Figure 1.
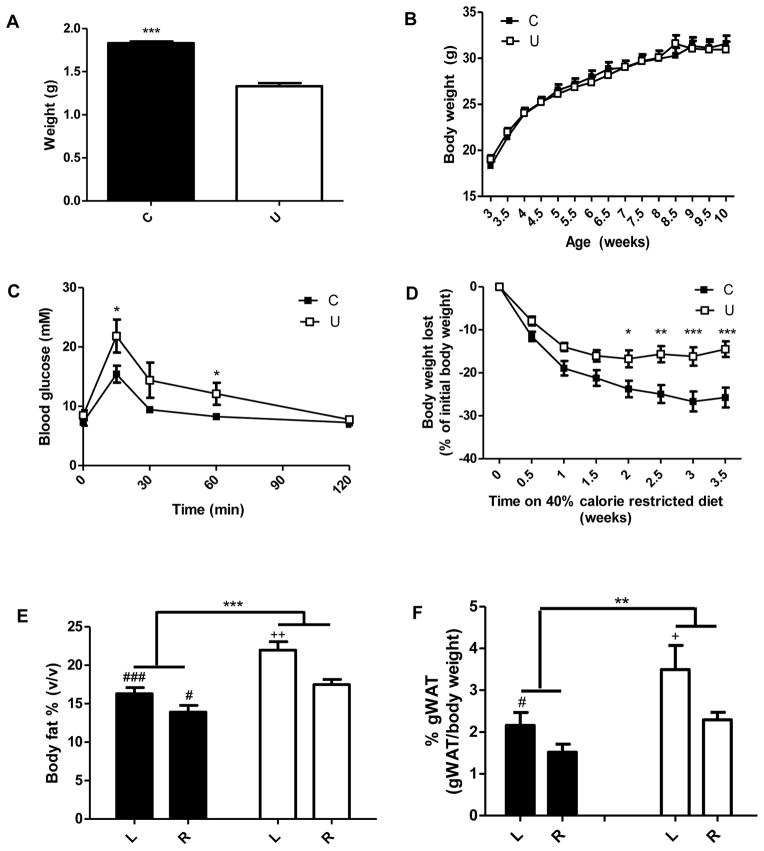
In utero undernutrition is associated with low birth weight, decreased glucose tolerance, decreased weight loss in response to calorie restriction and increased adiposity. A) Weight of the offspring at 1 day of age. Offspring from 7 dams per group were weighed. Student’s t-test, *** = p<0.0001, n=50–87. B) Bi-weekly body weight of offspring. Two way-repeated measures ANOVA, not significant, n=34. C) Blood glucose concentrations before and for 2 h after oral glucose administration (2 mg/g body weight). Oral glucose tolerance test was performed at age 10 wk. Two-way repeated measures ANOVA with Bonferroni post-hoc test, * = p<0.05, n=6–8. D) Change in bodyweight on a 40% calorie restricted diet started at 10 wk of age. Values are presented as percent of body weight prior to caloric restriction. Two-way repeated measures ANOVA with Bonferroni post-hoc test, * = p<0.05, ** = p<0.01, *** = p<0.001, n=11. E and F) Increased adiposity in 14 wk old offspring fed ad libitum (L) and after a 4 week 40% calorie restriction (R). Quantification of adipose tissue volume from spin-echo MR images with volume segmentation for total adipose tissue, n=4–5 (E), and amount of gonadal white adipose tissue (gWAT) expressed as a percentage of total body weight (F), n=8. Two-way ANOVA with Bonferroni post-hoc test, ** = p<0.01, *** = p<0.001, # = p<0.05 (C vs. U), ### = p<0.001 (C vs. U), + = p<0.05 (L vs. R), ++ = p<0.01 (L vs. R). Black = C (control offspring), white = U (in utero undernourished offspring). Values are mean ± SEM.

