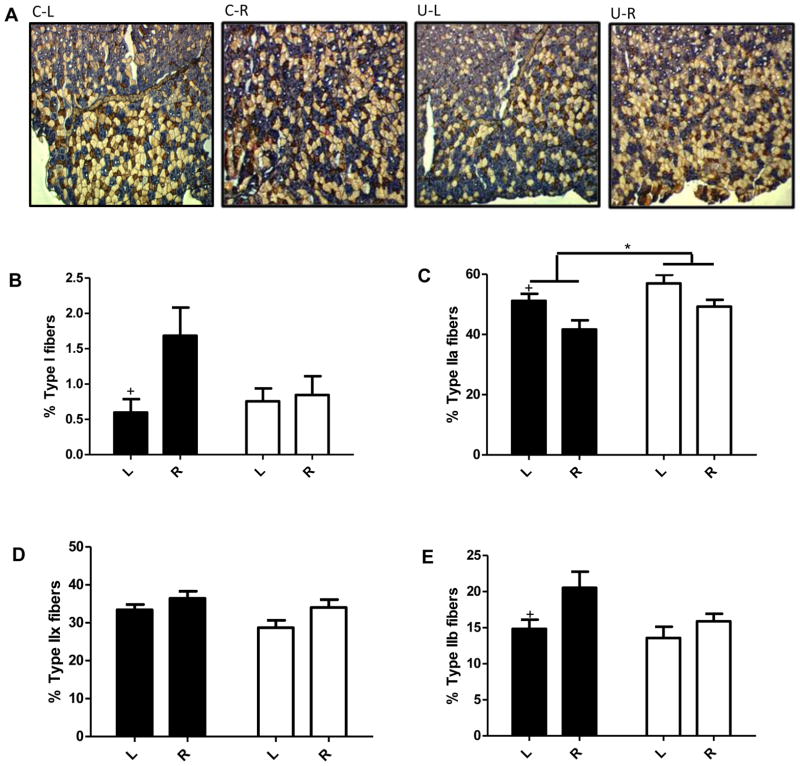
Figure 3.
Changes in fiber type in response to calorie restriction are eliminated with in utero undernutrition. Data for 14 wk old mice fed ad libitum (L) and after a 4 wk 40% calorie restriction (R). Fiber type proportions in the tibialis anterior. Muscle sections were stained based on myosin heavy chain expression for type I fibers (red; B), type IIa fibers (blue; C) and type IIb fibers (brown; D). Unstained fibers were counted as type IIx fibers (E). Proportions were calculated as the percent of the total number of fibers with an average of 988±38 fibers counted per image. Representative images are shown in A. Values are mean ± SEM, n=8. Two-way ANOVA with Bonferroni post-hoc test, * = p<0.05, + = p<0.05 (L vs. R). Black = C (control offspring), white = U (in utero undernourished offspring).

