
Figure 3.
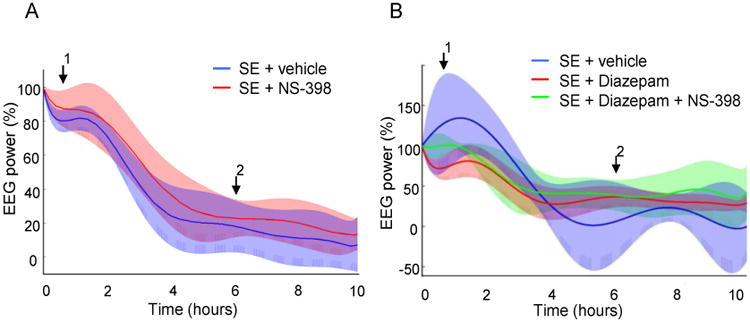
Analysis of subdural EEG recordings obtained for 10 h after the onset of the pilocarpine-induced SE from groups of A: vehicle (n = 12) and NS-398 (n = 10)-treated animals, and B: vehicle (n = 8), Diazepam (n = 8) and Diazepam + NS-398 (n = 7) animals. Percentage change in power in the γ-band showed no difference between the groups. The mean value (colored line) and 95% confidence interval (shaded area) is shown for each group. Arrow 1 indicates the time of the injection of vehicle, diazepam and/or NS-398 at 30 min after the first motor seizure. Arrow 2 indicates the time of the second injection of vehicle or NS-398.