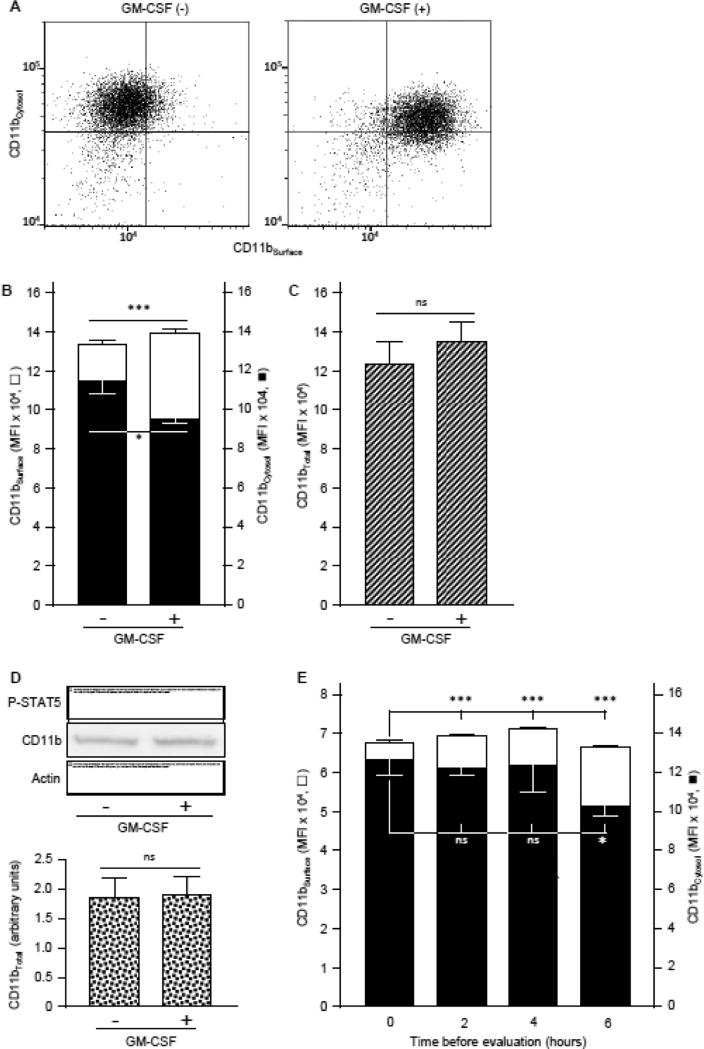
Fig. 6.
GM-CSF-stimulated translocation of CD11b to the neutrophil cell-surface. A,B. Fresh, heparinized blood from healthy people was evaluated for the level of CD11b except that cells were first immunostained with FITC-anti-human CD11b to measure CD11bSurface (open bars), washed, permeabilized and stained with PE-anti-human CD11b to measure cytosolic CD11bCytosol (filled bars) as described in the Methods. A. Representative cytograms of neutrophils stained to show CD11bSurface (horizontal axis) and CD11bCytosol (vertical axis) with or without GM-CSF stimulation (indicated). B. Bars represent the mean ± SD for n = 3 per condition. C. Both CD11bSurface and CD11bCytosol were evaluated with methods described above (legends to Panel A,B) with FITC-anti-human CD11b for both to measure total neutrophil CD11b levels. Bars represent the mean ± SD for n = 3 per condition. D. Quantification of total CD11b by western blotting. Proteins of white blood cell in the whole blood incubated with or without GM-CSF (10 ng/mL) was evaluated by gel electrophoresis and western blotting to quantify CD11b, phosphorylated-STAT5 (as a GM-CSF stimulation control), or actin (as a loading control), and CD11b band intensity quantified by densitometry as described in the Methods. Bars represent mean ± SD for n = 4 determinations per condition. E. Cytosolic CD11b translocation to the neutrophil cell surface with time. Fresh, heparinized blood from healthy people was incubated at room temperature for various times before differential immunostaining to quantify CD11bSurface (open bars) and CD11bCytosol (filled bars) as described above (legend to Panel A). Bars represent the mean ± SD of n = 3 per condition. Comparisons were made by Student's t test (A-C) or ANOVA (D); * = P<0.05, *** = P<0.001.

