
Fig. 3. Rate of incorrect donor or recipient sequence assignments.
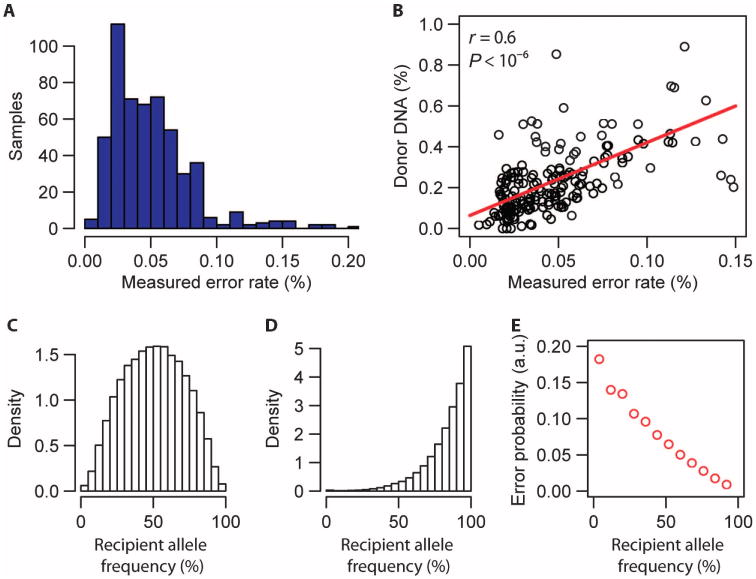
(A) Histogram of the measured per-sample error rate (error rates <0.2%, n = 540). (B) Linear correlation between the measured donor DNA fraction for patients at quiescence (biopsy score 0, n = 185) and measured error rate (Spearman correlation coefficient, r). The red line is a linear fit, slope (a) = 3.6 ± 0.36 (linear regression, t value slope = 9.4). (C) Histogram of the recipient allele frequency (frequency of occurrence in the human population) for SNP markers that were used to discriminate donor- and recipient-derived sequences and to measure the cfdDNA fraction (n = 7 patients, all markers). Here, SNPs were selected for which both the donor and recipient were homozygous and carried a different allele (for example, marker n in Fig. 2A). Allele frequency data were obtained from http://hgdownload.cse.ucsc.edu/goldenPath/hg19/database/. (D) Histogram of the recipient allele frequency for SNP markers that were used to extract the matched error rate (n = 7 patients, all markers). Here, SNPs were selected for which donor and recipient were homozygous and carried the same allele (for example, marker n + 1 in Fig. 2A). (E) Probability of a matched error as function of the recipient allele frequency (n = 42,188 measurements). a.u., arbitrary units.