
Fig. 5. Performance of cfdDNA as a marker for heart transplant rejection.
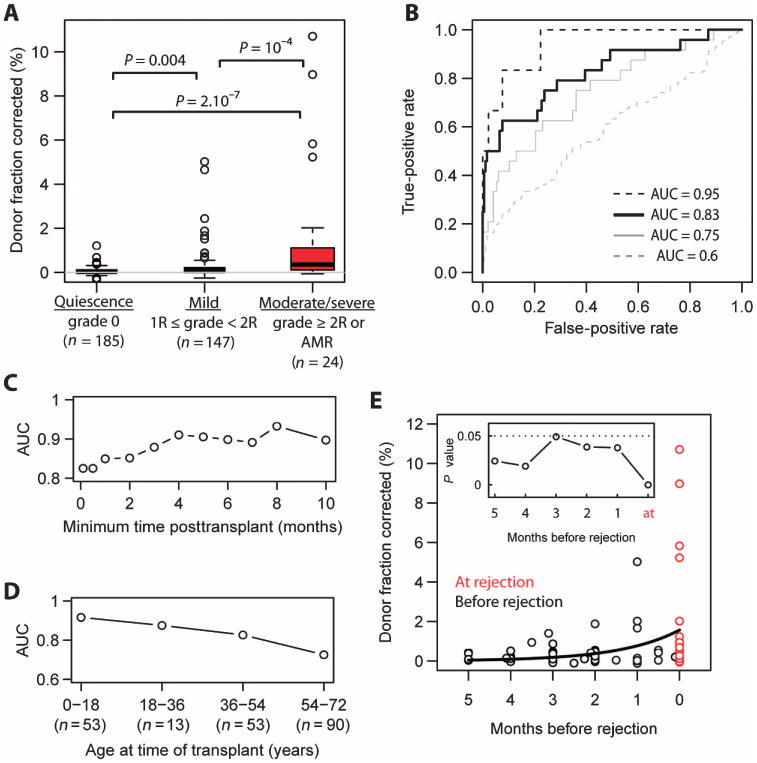
(A) Box plots of the fraction of cfdDNA for stable heart transplant recipients (biopsy grade 0), recipients diagnosed with mild rejection (1R/1A ≤ grade < 2R/3A), and recipients diagnosed with moderate-to-severe rejection (grade ≥2R/3A or AMR). P values were determined by Mann-Whitney U test. n is the number of samples for each group. The measured donor fraction was corrected by subtracting a factor aε, where a is the slope of the linear fit in Fig. 3B (a = 3.6) and ε is the measured error rate. (B) ROC analysis of the performance of cfdDNA in classifying moderate-to-severe rejecting (AUC 0.83, black solid line) and nonrejecting recipients (grade 0). Also shown are ROC curves that analyze the performance of the cfdDNA assay in distinguishing moderate-to-severe rejection versus mild rejection events (AUC = 0.75, gray solid line), mild rejections versus the absence of rejection (AUC = 0.6, gray dashed line), and severe rejection events (3B/3R, n = 6) versus the absence of rejection (AUC 0.95, black dashed line). (C) Test performance [AUC, 0 versus moderate-to-severe, black solid line in (B)] as a function of time after transplant, after which samples were taken into account. (D) AUC as a function of the age of the recipient at the time of transplant. (E) Potential for early diagnosis. The donor DNA level before the diagnosis of a moderate-to-severe rejection episode (grade ≥2R/3A or AMR, red data points). Black line, single-exponent fit: y = Ae(t/τ0), with best-fit values (least squares) of A = 1.6 and τ0 = 43 days. Inset: P values for all 1-month time periods tested (Mann-Whitney U test).