
Fig. 2.
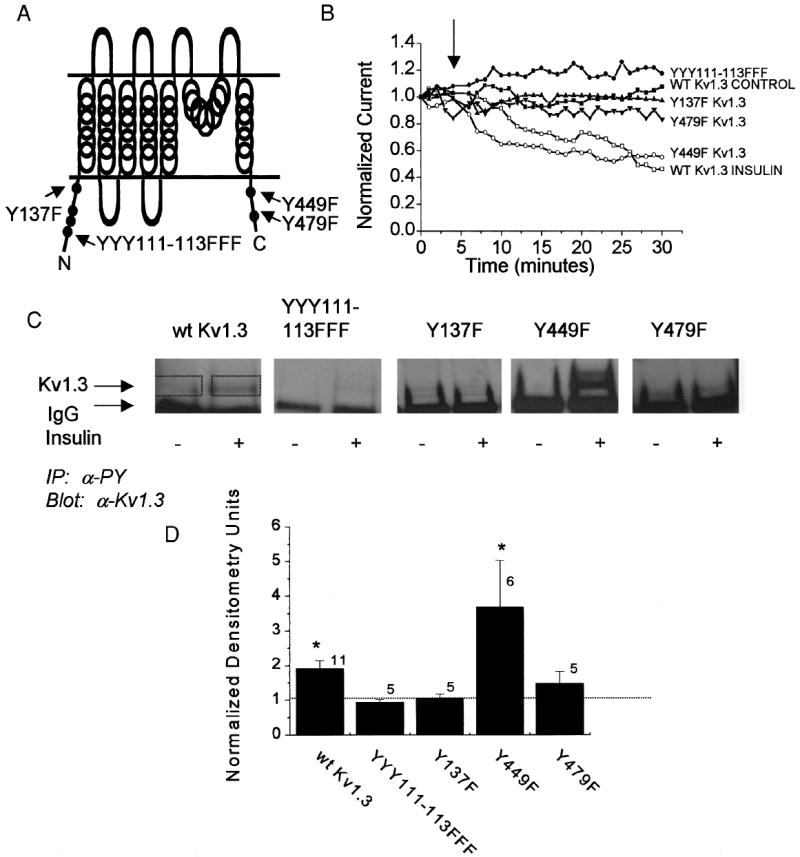
Kv1.3 is phosphorylated by IR kinase at multiple tyrosine residues to induce current suppression of the ion channel. A: cartoon of the Kv1.3 ion channel secondary structure indicating the amino and carboxyl cytoplasmic sites where single tyrosine to phenylalanine point mutations (Y to F) were introduced. B: plot of the normalized current magnitude of a HEK 293 cell cotransfected with wild-type Kv1.3 ion channel plus IR kinase. The cell-attached patch was held at –90 mV and stepped to a single depolarizing potential of +40 mV in 1-min interpulse durations without (WT Kv1.3 CONTROL) or with (WT Kv1.3 INSULIN) application of 0.1 μg/ml insulin at the arrow. All Kv1.3 ion channel mutants were cotransfected with IR kinase and stimulated with insulin at the arrow. Closed symbols, no significant difference; open symbols, significant difference (paired t-test, time 5 vs. time 30). Shown are representative plots out of 6–10 recordings per channel construct (see results). C: HEK 293 cells cotransfected with IR kinase and Kv1.3 constructs as indicated without (−) and with (+) insulin stimulation for 20 min. Cells were then harvested and immunoprecipitated (IP) with anti-4G10 (αPY) that recognizes tyrosine phosphorylated proteins. Nitrocellulose blots were probed with antiserum for Kv1.3 (1:200). Arrows, band corresponding to the Kv1.3 ion channel protein and the IgG fraction, respectively. D: histogram representation of the change in phosphorylation of Kv1.3 under insulin stimulated/unstimulated conditions. Densitometry units were calculated within single Western blots to standardize any variance in ECL exposure time (see boxes used to determine pixel density). A ratio of 1.0 (no difference) is denoted by the dashed line. *Significantly different, Student’s t-test (Arc-sin transformation of percentage data).