
Fig. 4.
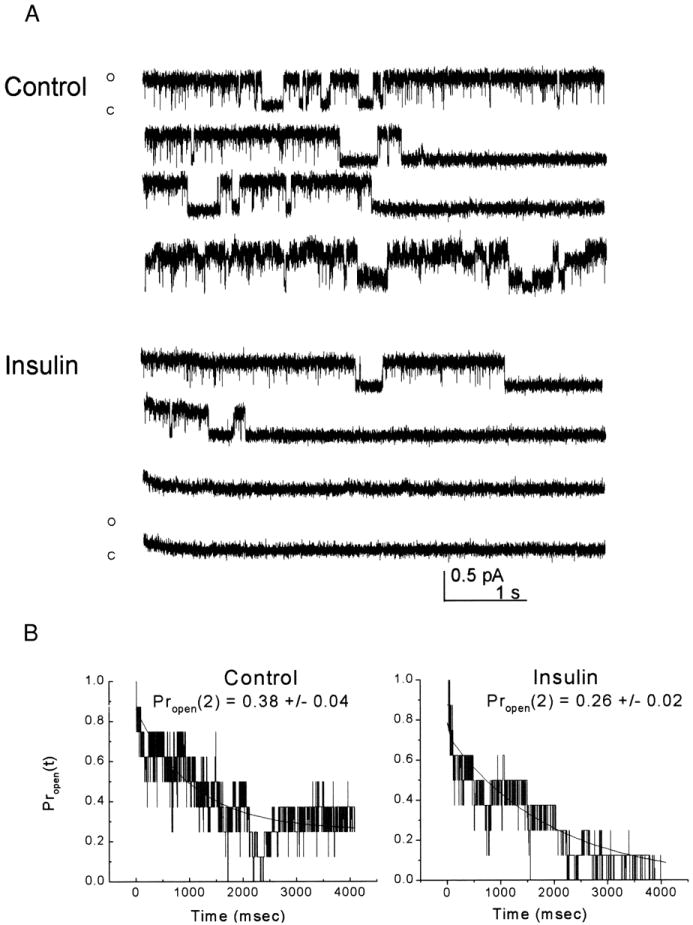
Unitary OBN current is suppressed by insulin. A (control): cell-attached OBN under control-patch recording conditions in which both the tip and barrel of the electrode were filled with control solution. The patch was held at −90 mV and stepped to +40 mV for a duration of 5 s. The interval between voltage-stimulation was set at 1 min to allow Kv1.3 to fully recover from C-type inactivation and prevent cumulative inactivation. Shown is every other record for the first 8 min. Trace is representative of four such recordings (Insulin). Cell-attached OBN where the patch electrode was tip filled with control patch solution and then the barrel of the electrode was back-filled with 0.1 μg/ml insulin. Same voltage and stimulation protocol as above. Trace is representative of three such recordings. B: schematic representation of the time-dependent open probability [Propen (t)] calculated in 500-μs increments for the patches recorded in A. Each representation is an average of the 8 idealized records captured for the first 8 min under conditions in which the electrode was back-filled with control patch solution (Control) or insulin (Insulin) as above. Line graphs were fitted with a second-order exponential decay and Propen was determined for time 2 s [Propen (2)] under control and insulin conditions. Mean ± SE as noted in the figure and described in detail in the text.