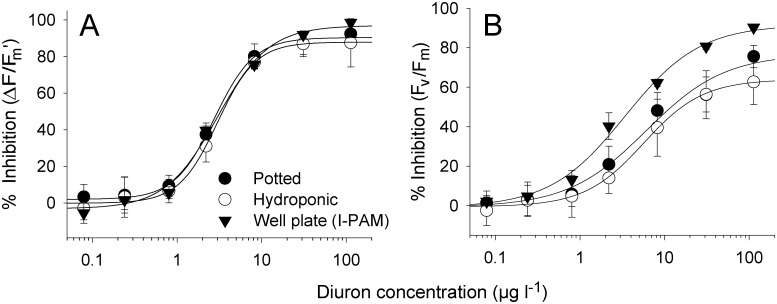
Fig 4. Dose-response curves for Diuron and H. ovalis using 12-well plate vs potted and hydroponic arrangements.
Inhibition (%) of A) effective quantum yield (∆F/F m’) and B) maximum quantum yield of PSII (F v/F m) after a 24 h exposure period to a series of Diuron concentrations at 100 μmol photons m-2s-1. Yield inhibitions were calculated against mean yield values for solvent controls at the corresponding irradiance. n = 9 ± SE, curve fits exhibited r2 between 0.98 and 0.99.

