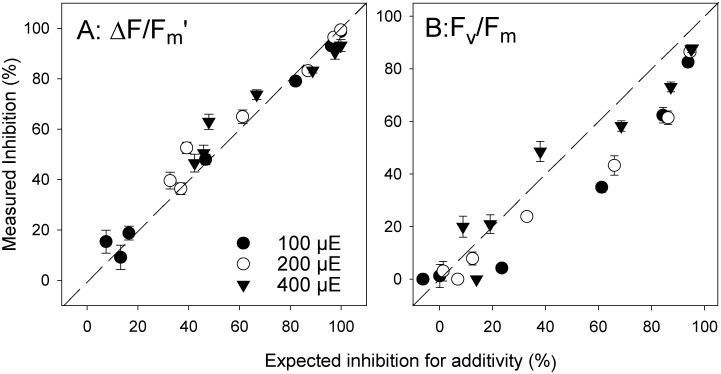
Fig 7. Measured vs expected toxicities.
Comparison between measured and expected (IA) combined effects of elevated light intensities and Diuron on A) ∆F/F m’ and B) F v/F m of H. ovalis. Data points intersecting the zero-interaction line indicate additivity; points below the additivity line suggest sub-additivity; and datapoints above the additivity line indicate synergism. All inhibition calculated relative to 40 μmol photons m-2 s-1 solvent control mean. Mean ± SE of nine replicate leaves.

