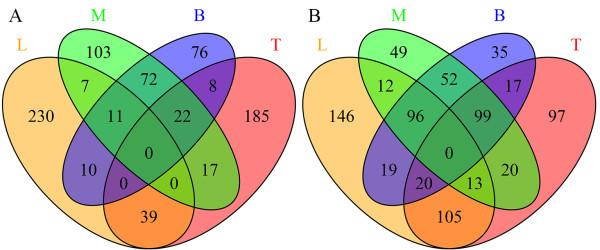
Figure 1.

Numbers of unigenes that were differentially expressed in the four samples. Numbers displayed were either up-regulated (A) or down-regulated (B) in the four samples, which were stem shoot with leaves (sample L), top part of stem bark (sample T), middle part of stem bark (sample M) and bottom part of stem bark (sample B). Numbers of unigenes that shared simultaneously differentially expressed patterns in more than one sample displayed at the intersections of the correspondent samples.
