
Figure 3.
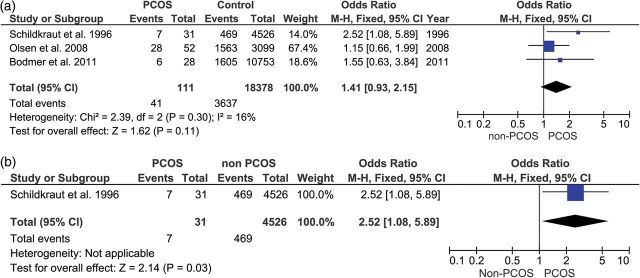
(a and b) Upper forest plot: ovarian cancer in women with PCOS compared with controls. Lower forest plot: ovarian cancer in PCOS compared with controls in women under 54 years old.
Official websites use .gov
A
.gov website belongs to an official
government organization in the United States.
Secure .gov websites use HTTPS
A lock (
) or https:// means you've safely
connected to the .gov website. Share sensitive
information only on official, secure websites.
(a and b) Upper forest plot: ovarian cancer in women with PCOS compared with controls. Lower forest plot: ovarian cancer in PCOS compared with controls in women under 54 years old.