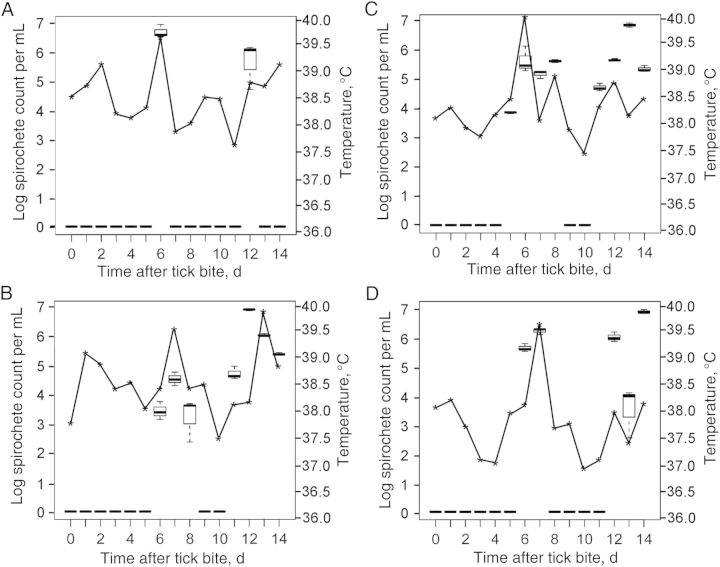
Figure 3.
A–D, Comparisons of Borrelia turicatae densities in the blood with daily temperature readings for JB23 (A), JB60 (B), JD03 (C), and IN57 (D). Box and whisker plots indicate the lower and upper quartiles, median, and lower and upper extremes of spirochete densities, while the asterisks represent the temperature at the time of blood specimen collection.

