
Figure 2.
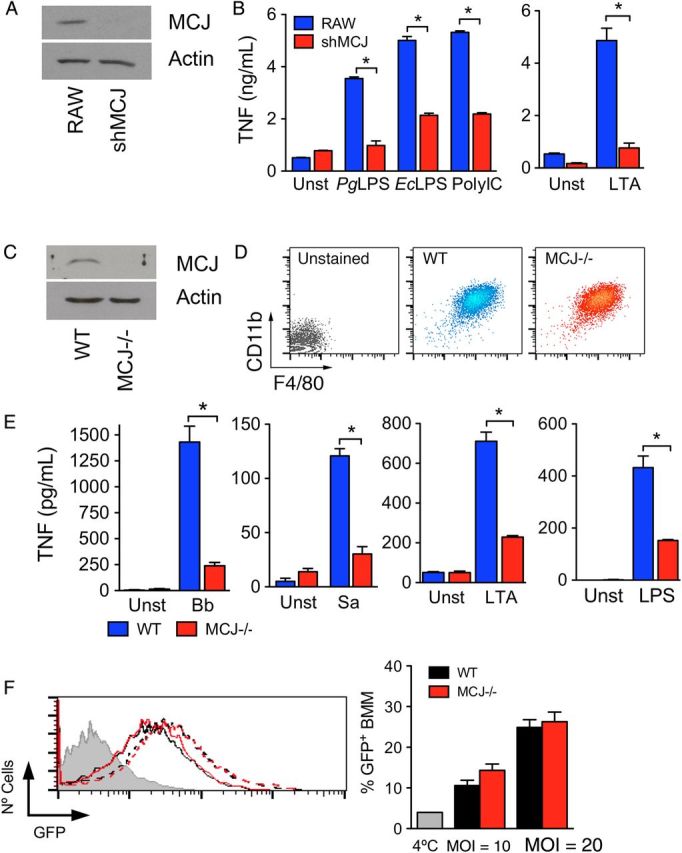
MCJ regulates tumor necrosis factor (TNF) production in response to proinflammatory stimuli. A, shMCJ cells, generated by stable transfection with a plasmid containing small interfering RNA sequences targeting MCJ, show decreased levels of the protein by Western blotting. B, TNF production of RAW (blue bars) and shMCJ (red bars) cells in response to stimulation with several Toll-like receptor (TLR) ligands: PgLPS, lipopolysaccharide (LPS) from Porphyromonas gingivalis; EcLPS, LPS from Escherichia coli; PolyIC, polyinosinic-polycytidylic acid; and LTA, lipoteichoic acid from Staphylococcus aureus. C, Analysis by immunoblotting of MCJ protein levels in bone marrow–derived macrophages (BMMs) from wild-type (WT) and MCJ knockout (KO; MCJ−/−) mice. D, Levels of expression of CD11b and F4/80 in BMMs differentiated from WT and MCJ KO mice. E, TNF production by WT (blue bars) and MCJ KO (red bars) BMMs in response to live Borrelia burgdorferi (Bb; multiplicity of infection [MOI], 25), S. aureus (Sa; MOI, 10), and the TLR ligands LTA and LPS. *P < .05. F, Phagocytosis of B. burgdorferi by WT (black lines) and MCJ-deficient (red lines) BMMs at 2 different MOIs: 10 (continuous lines) and 20 (broken lines). The gray histogram represents a 4°C control to determine binding but not internalization, as well as cell washing efficiency. The histogram on the left shows a representative experiment. The graph on the right corresponds to the percentage of green fluorescent protein (GFP)–expressing cells in triplicates. The experiments are representative of at least 3 performed in each case. Abbreviation: Unst, unstimulated.