
Figure 3.
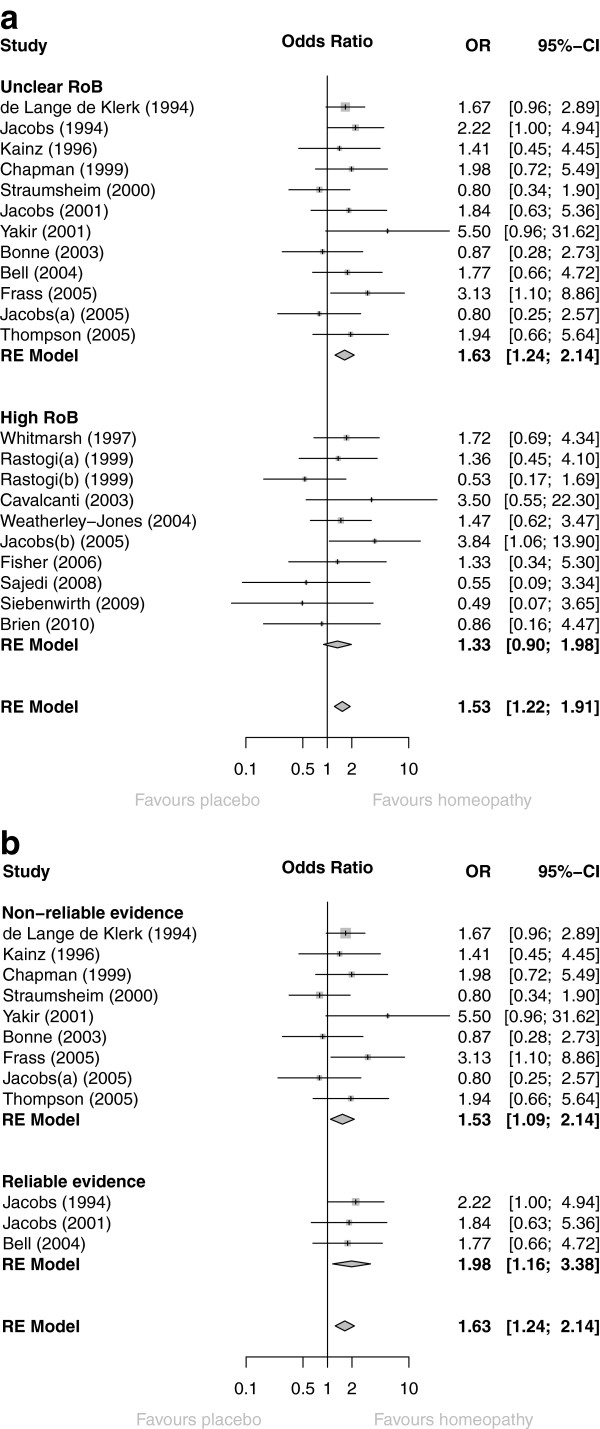
Forest plots showing odds ratio (OR) and 95%cconfidence interval (CI) for each of (a) 22 RCTs of individualised homeopathy, with pooled OR (random-effects [RE] model) for trials with unclear risk of bias (RoB), high RoB, and for all 22 RCTs; (b) 12 ‘B’-rated RCTs of individualised homeopathy, with pooled OR (RE model) for trials with non-reliable evidence, reliable evidence, and for all 12 RCTs.