
Figure 5.
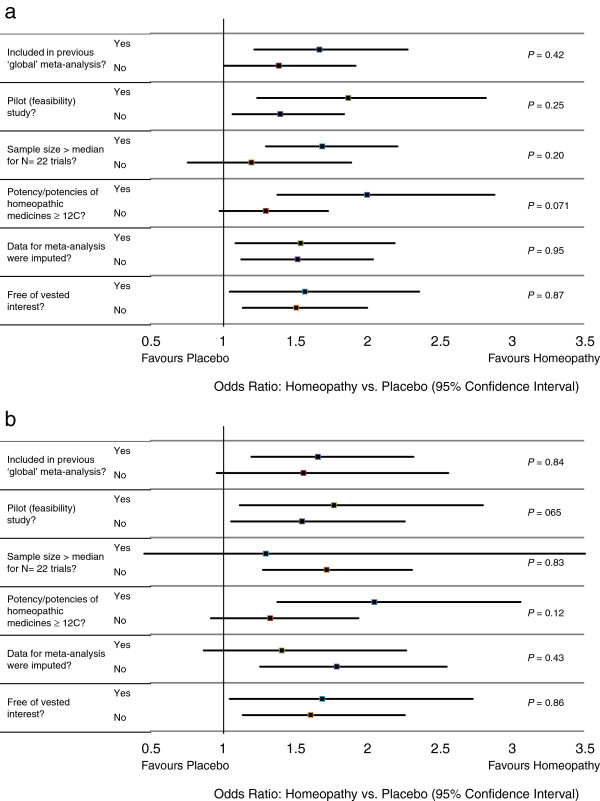
Interactions between sub-groups for (a) all N = 22 trials with analysable data and (b) N = 12 ‘B’- rated trials.
Official websites use .gov
A
.gov website belongs to an official
government organization in the United States.
Secure .gov websites use HTTPS
A lock (
) or https:// means you've safely
connected to the .gov website. Share sensitive
information only on official, secure websites.
Interactions between sub-groups for (a) all N = 22 trials with analysable data and (b) N = 12 ‘B’- rated trials.