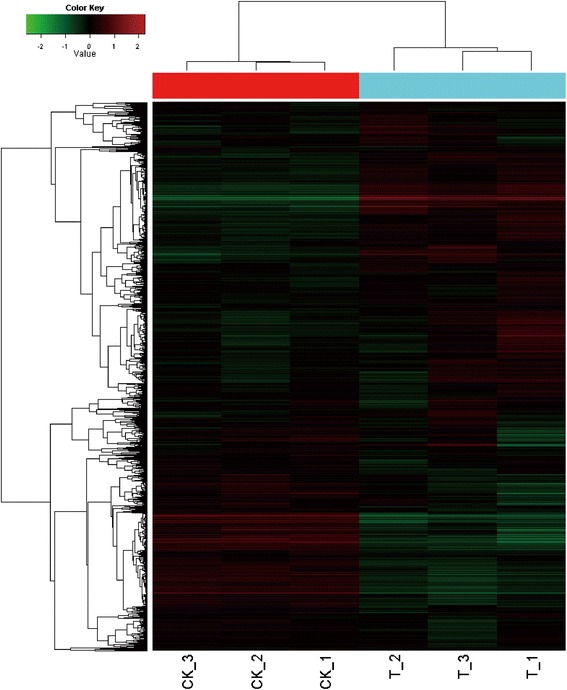
Figure 3.

Cluster analysis of microarray data. CK, B. subtilis OKB105 without contact with rice seedlings; T, B. subtilis OKB105 after interaction with rice seedlings. The cluster analysis was performed using Cluster 3.0 software. Red and green indicate higher (>2.0) and lower (<0.5) ratios, respectively. Each treatment was repeated three times.
