Figure 1.

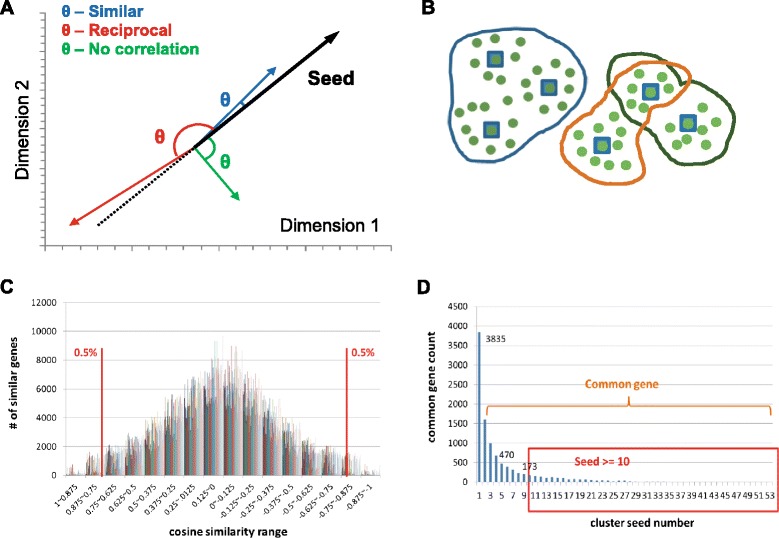
Cosine similarity analysis methodology for determining co-differentially regulated genes in the feather/scale region. A) 2D representation of the concept of cosine similarity analysis. The actual analysis occurs in a 20-dimension hyperspace. θ represents the angles between a probe vector and a differentially expressed vector. B) 2D representation of the clustering concept after the identification of similarly regulated vectors. Differentially expressed genes and their correlated probes are represented by blue squares and green circles, respectively. The correlated differentially expressed genes and probes are clustered (encircled gene sets by the outlines of different colors representing different clusters). Some differentially expressed genes and probes may be clustered into more than one group. C) Demonstration of cosine value distribution for each seed. The cosine value distributions are normalized by Fisher transformation. The upper 0.5% and lower 0.5% mark the selection boundaries in choosing probes with similar regulation patterns. D) Distribution of genes that share common seeds. Genes sharing more than 10 common seeds are shortlisted for their potential roles in developmentally important pathways.
