
Fig. 1.
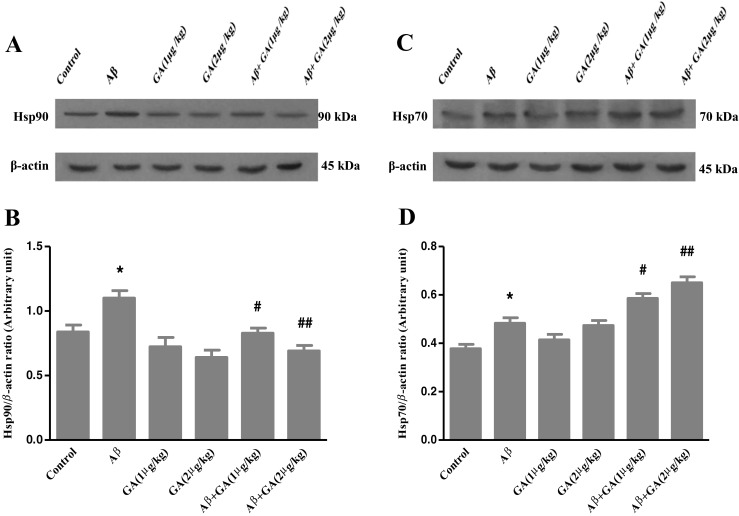
Western blot analyses to measure the effects of different concentrations of geldanamycin (GA), i.c.v. administration of 1 μg and 2 μg/kg, on Hsp90 and Hsp70 levels in the hippocampus of Aβ-injected rats. a, c Sixty micrograms of proteins were separated on SDS-PAGE, Western blotted, probed with specific primary antibodies and reprobed with anti β-actin antibody (Western blot was repeated two times for each animal, n = 3). b The densities of Hsp90 bands were measured and their ratios to β-actin bands were calculated. d The densities of Hsp70 bands were measured and their ratios to β-actin bands were calculated. Each point shows the mean ± SEM. *P < 0.05 versus control group. # P < 0.05; ## P < 0.01 versus the Aβ-injected group