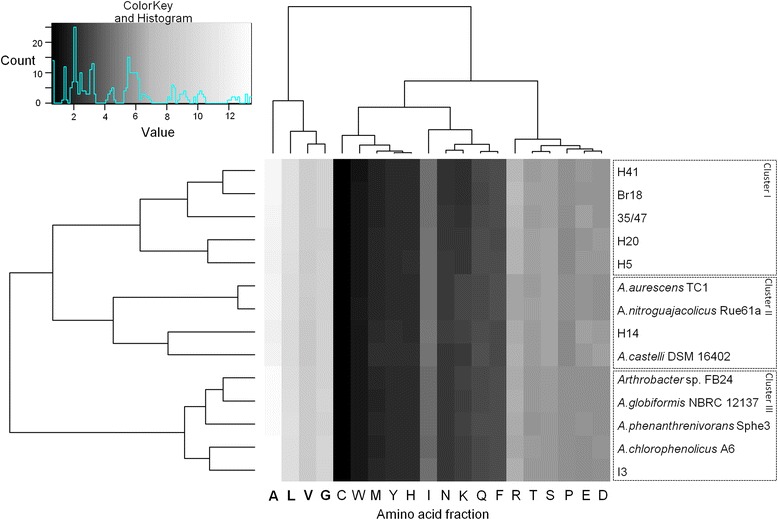
Figure 3.

Amino acid usage heatmap of seven temperate Arthrobacter spp. and seven Antarctic Arthrobacter isolates based on their protein content. The percentage of amino acid usage was plotted in gplots using R. Amino acids highlighted in bold face represent abundant amino acids.
