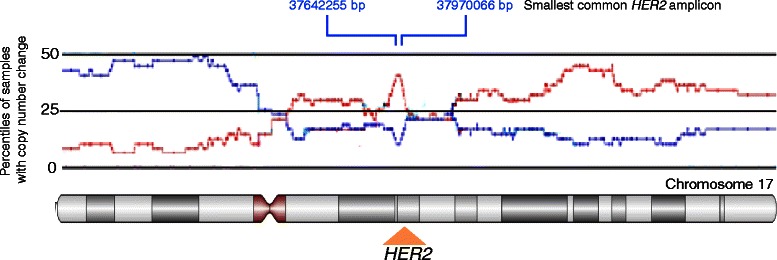
Figure 1.

Schematic representation of copy number variations across chromosome 17. The percentiles of SNP samples with amplification or deletion among the breast tumor samples analysed on SNP 500 K are indicated in red and blue, respectively. The positions of HER2 and the smallest amplicon containing 9 full-length genes (from 37642255 to 37970066 based on Hg19) are indicated.
