
Figure 3.
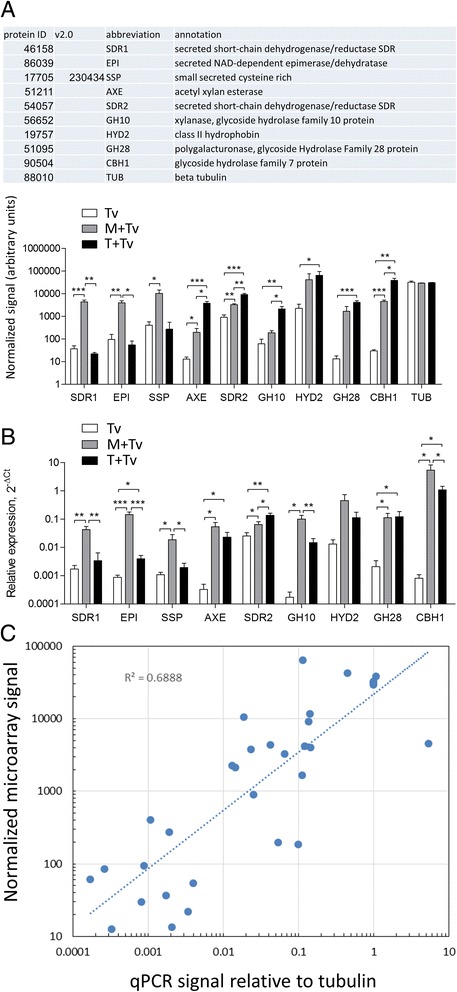
qPCR validation of microarray data. A) qPCR signals normalized to tubulin (ID 88010), and corresponding microarray data, normalized to total signal as described in Methods. Bars indicate means of 3–8 replicates with standard error; the M + Tv and T + Tv samples for qPCR were independent of those used for the microarrays. *,**,** significant at P < 0.05, 0.01, 0.001 respectively, by ttest, one-tailed. B) Microarray data corresponding to the transcripts shown in (A). *,**,** significant at P < 0.05, 0.01, 0.001 respectively, by ttest, one-tailed. C) Correlation between qPCR and microarray signals, plotted from the data in (A and B). The line is a power-law least squares fit (Excel) to the combined data set (Tv, M + Tv, T + Tv), which appears linear on this log-log plot. The R2 value is shown on the graph.