
Figure 5.
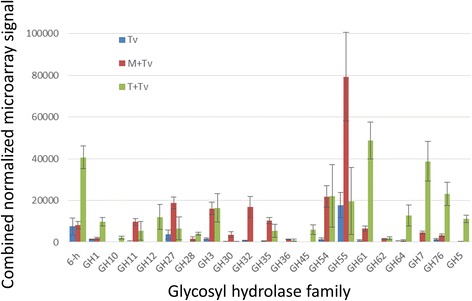
Representation of glycoside hydrolase (GH) families. The bars represent the sum of average transcript abundance (microarray signal) for each family. The error bars indicate SEM for families with a single member represented; for families with two or more members, the SEM values were combined using the sum of squares rule, to provide an approximate measure of variability.