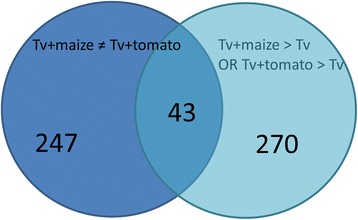
Figure 6.

Venn diagram of the number of genes differentially expressed in T. virens interactions with maize vs tomato roots. The intersection of the two sets indicates transcripts that were significantly different (B-H P < 0.05 by CyberT) in tomato compared to maize, and also significantly up-regulated compared to control (Tv) in either tomato (T) or maize (M) interactions.
