Figure 4.

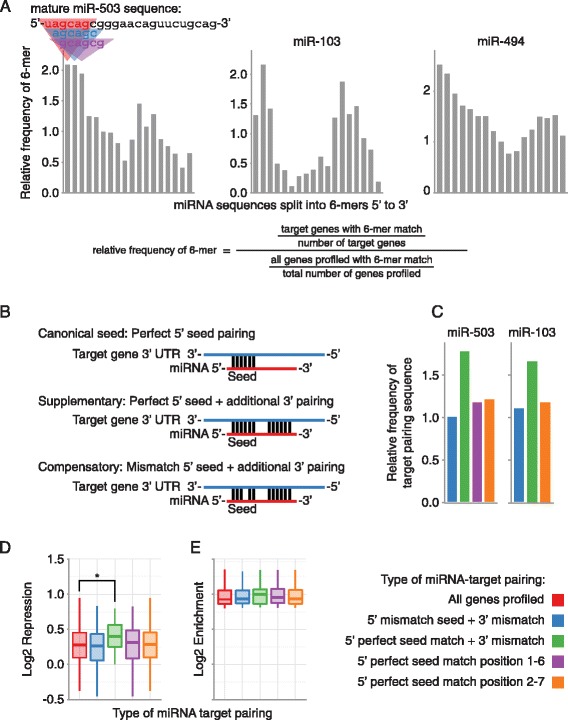
miRNA targeting utilizing pairing outside of the canonical miRNA 5′ seed region. (A) Enrichment of sequences pairing to the 3′ end of the miRNAs in the experimentally determined miRNA targetomes. The Y-axis indicates the frequency of a 6-mer in the experimentally determined miRNA target mRNAs relative to all mRNAs profiled. 6-mers are organized step-wise in 1 nucleotide increments along the X-axis from 5′ end to 3′ end of the mature miRNA. (B) Different types of miRNA-target pairing. (C) Frequency of different types of miRNA pairing in RIP-Seq enriched mRNAs. Bars are the frequency of mRNAs with the indicated type of miRNA-target pairing in the RIP enriched mRNAs, relative to the frequency of mRNAs with the indicated type of miRNA-target pairing in all mRNAs profiled. (D) RIP-seq enriched mRNAs containing a supplementary target site in their 3′UTR were significantly more repressed than all RIP-seq enriched mRNAs, but not more repressed than RIP-seq enriched mRNAs that contain a perfect 5′ seed in their 3′UTR (p = 0.04 and 0.06, respectively, Student’s t-test). Each box and whiskers plot indicates gene expression repression for genes that contain the type of miRNA-target pairing specified on the X-axis. Boxes extend from the 1st to 3rd quartile of gene expression repression, the band is the median, and whiskers denote the minimum and maximum excluding outliers. (E) There were no significant differences in miR-503 RIP enrichment in RIP enriched mRNAs with different types of miRNA-target pairing. Each box and whiskers plot indicates RIP enrichment for mRNAs that contain the type of miRNA-target pairing site specified on the X-axis. For C, D, and E, 5′ mismatch seed + 3′ mismatch (blue) corresponds to Compensatory in B; 5′ perfect seed match + 3′ mismatch (green) corresponds to Supplementary in B; and 5′ perfect seed match (purple and orange) correspond to Canonical seed in B. *P < 0.05.
