
Figure 6.
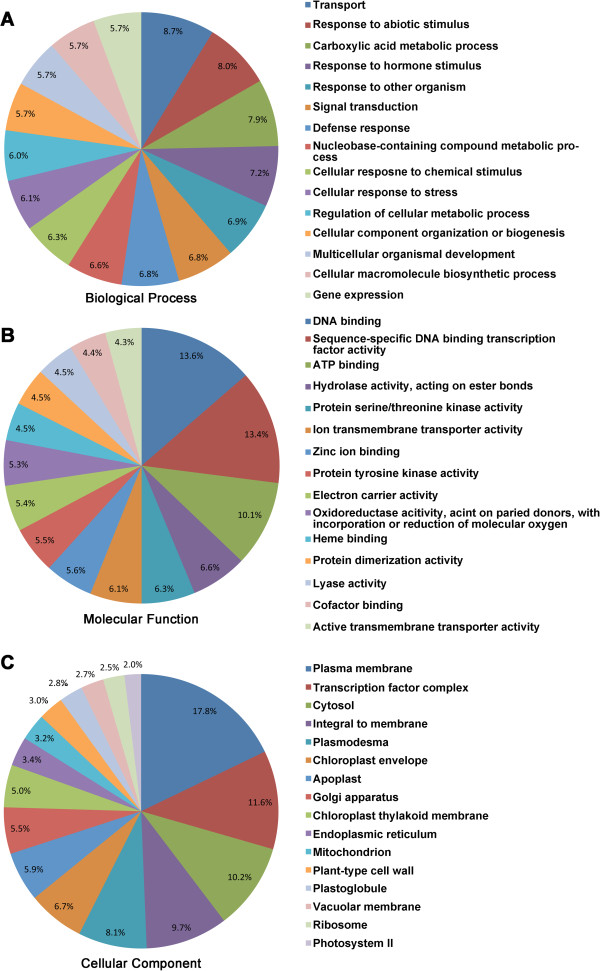
GO terms associated with upregulated DEGs. A) GO terms in the Biological Process category. B) GO terms in the Molecular Functions. C) GO terms in Cellular Components. The values labeled in the pie charts of panel A, B and C are the percentage of DEGs annotated with the corresponding GO term relative to the total DEGs.