
Figure 4.
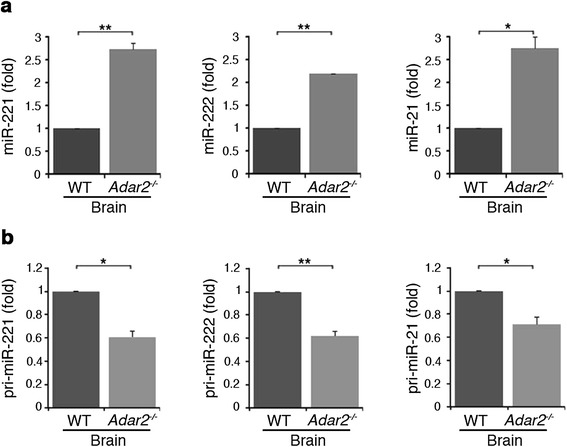
Altered expression of mature and primary miR-221, -222 and -21 in wild-type and Adar2 -/- mouse brain tissue. (a) Mature miR-221 (left panel), miR-222 (middle panel) and miR-21 (right panel) expression levels were analyzed using specific qRT-PCRs in wild-type (WT, dark gray) and Adar2 -/- (medium gray) mouse brain tissue. (b) Primary miR-221 (left panel), pri-miR-222 (middle panel) and pri-miR-21 (right panel) expression levels were measured using specific qRT-PCRs in the same samples. Mature miRNAs were normalized to RNU6B and pri-miRNAs were normalized to β-actin levels. The expression levels were calculated as a relative-fold increase compared with the wild-type samples arbitrarily set to 1. Mean ± standard error of the mean (n = 3), **P < 0.01, *P < 0.05.