
Figure 1.
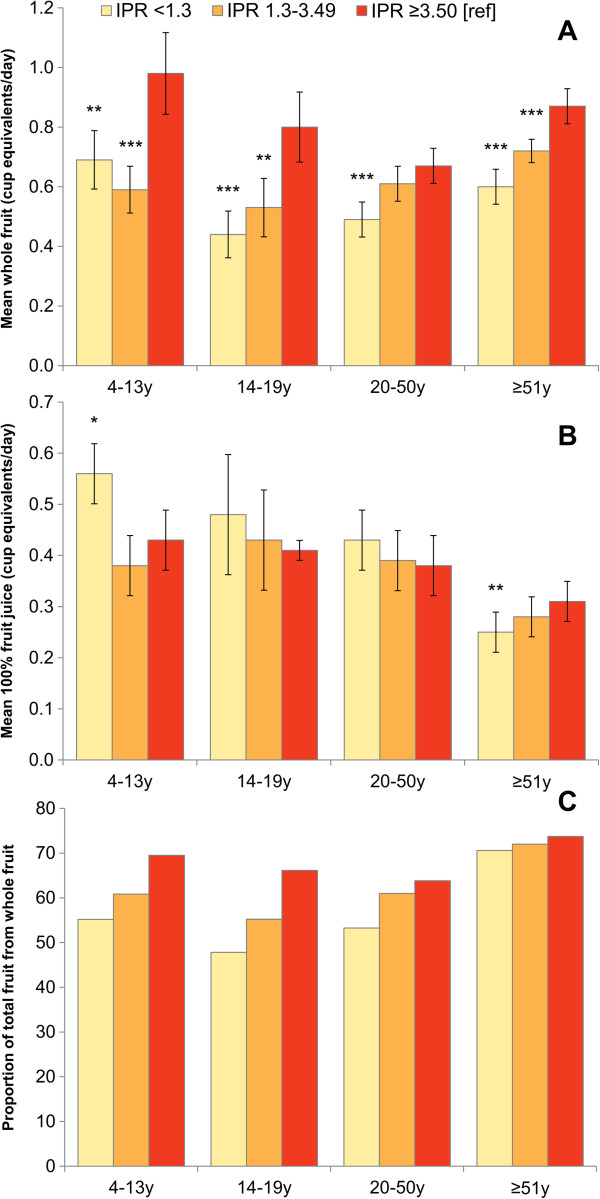
Amounts of whole fruit and fruit juice (in cup equivalents) and proportion of total fruit from whole fruit by age group. Panel A: whole fruit; Panel B: 100% fruit juice; Panel C: Proportion of total fruit from whole fruit. NHANES 2007–10. Error bars are 95% confidence intervals and asterisks indicate significant difference in mean compared to the highest income group (***p < 0.001; **0.001 < p < 0.01; *0.01 < p < 0.05). Significance testing for proportions not conducted.