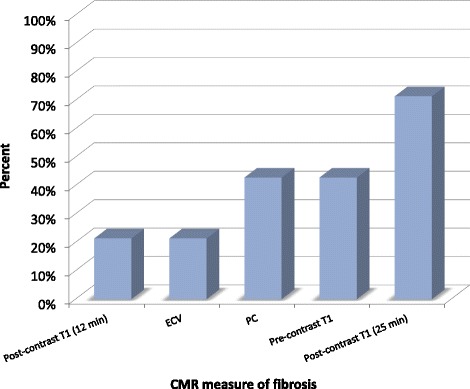
Figure 1.

Percentage of cardiovascular risk models showing significant relationship with CMR indices of fibrosis. Only risk models that show expected directions of beta coefficients are shown (i.e. increased risk vs. lower post gadolinium T1 times or greater ECV, partition coefficient and native T1 time). For men, 25 minute post gadolinium T1 values showed the most consistent relationship to cardiovascular risk scores. Only models for men are shown. ECV = extracellular volume fraction; λ = partition coefficient. Bars indicate standard deviation.
