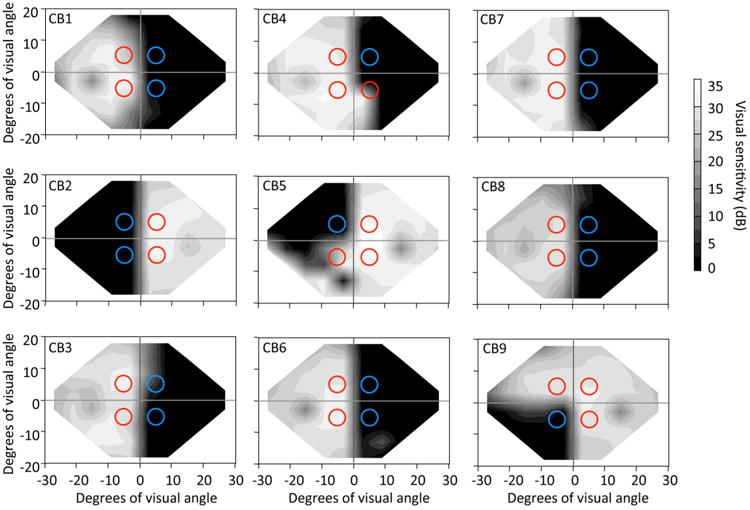
Figure 1.

Humphrey visual field perimetry (24-2 test) assessed monocularly and averaged across the two eyes. The grey scale indicates average luminance detection sensitivity in dB. Circles represent the visual field locations and sizes of random dot stimuli the subjects were asked to discriminate: red circles indicate stimuli that were presented in quadrants of intact vision, while blue circles represent stimuli that were not discriminable because they were presented inside blind regions of the visual field.
