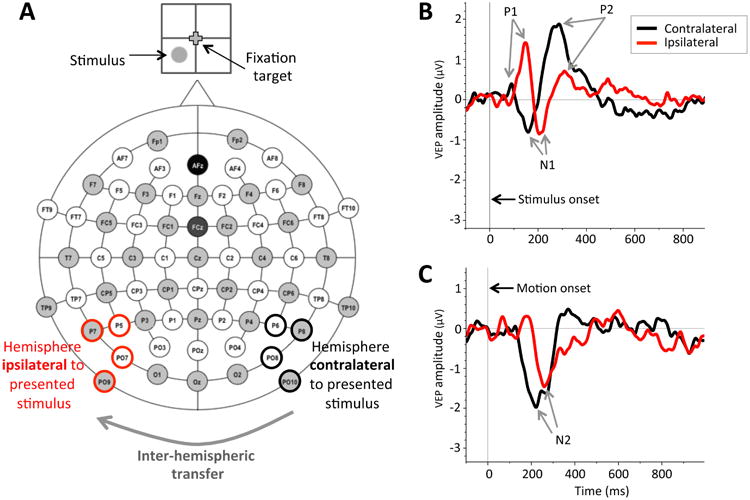
Figure 3.

Recording of Visual Evoked Potentials (VEPs) during lateralized stimulus presentation. A: Schematic representation of 64 electrode locations used, with analyzed electrodes highlighted in black (contralateral to stimulus presentation, indicated in the cartoon on top) and red (ipsilateral to stimulus presentation). Ipsilateral responses are thought to arise because of inter-hemispheric transfer from the brain hemisphere contralateral to the presented stimulus. B: Grand average waveforms obtained from the contralateral and ipsilateral brain hemispheres in visually-intact control subjects for stimulus onset VEPs (SO-VEPs) during stimulus presentation in the lower left visual field quadrant (shown in A). Vertical line at time 0 ms indicates random dots onset. P1, N1, and P2 designate SO-VEP components analyzed. The black line shows SO-VEP responses from the brain hemisphere contralateral to the presented stimulus - i.e. from pooled P6, P8, PO8, and PO10 electrodes (outlined in black in A). Red line shows SO-VEP responses from the brain hemisphere ipsilateral to the presented stimulus - i.e., from pooled P5, P7, PO7, and PO9 electrodes (outlined in red in A). C: Grand average waveforms of control subjects for motion onset VEPs (MO-VEPs) illustrating the clear N2 component obtained for stimulus presentation in the lower left quadrant. Vertical line at time 0 indicates the onset of dot motion. As in B, the black waveform represents contralateral MO-VEP response, while the red waveform represents the ipsilateral MO-VEP response. In both B and C, the difference in latency between the red and back peaks/troughs denotes the inter-hemispheric transfer time.
