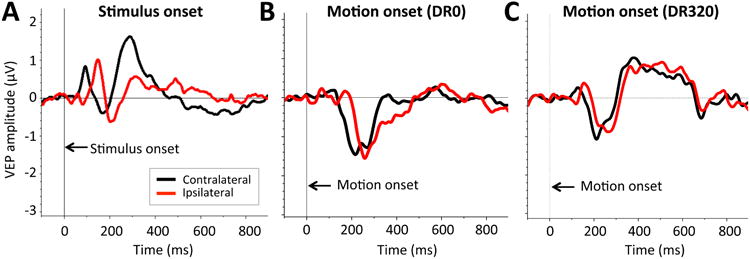
Figure 5.

Grand average waveforms in control subjects. A: Mean grand average SO-VEPs averaged across all 4 visual field quadrants. B: Mean grand average MO-VEPs for DR0 motion stimuli. C: Mean grand average MO-VEPs for DR320 motion stimuli. Black traces represent MO-VEP responses from the brain hemisphere contralateral to stimulus presentation. Red traces represent MO-VEP responses from the brain hemisphere ipsilateral to stimulus presentation.
