Figure 7.

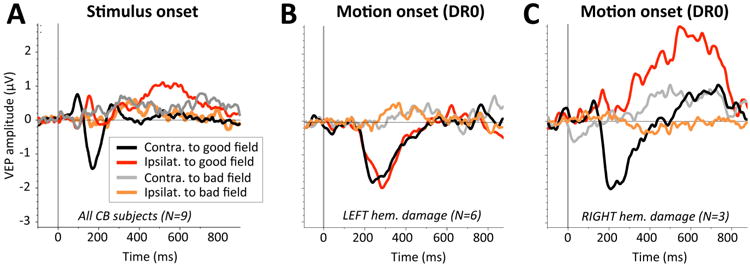
Grand average waveforms obtained in response to stimulus onset (SO-VEPS) and motion onset (MO-VEPs) in CB subjects. A: Grand average SO-VEPs obtained contralateral (black trace) or ipsilateral (red trace) to intact visual field quadrants, and contralateral (gray trace) or ipsilateral (orange trace) to blind field quadrants. B: Grand average MO-VEP waveforms for DR0 motion stimuli obtained in CB subjects with left brain hemisphere damage only. Color conventions as in A. C: Grand average MO-VEP waveforms for DR0 motion stimuli for CB subjects with right brain hemisphere damage only. Color conventions as in A.
