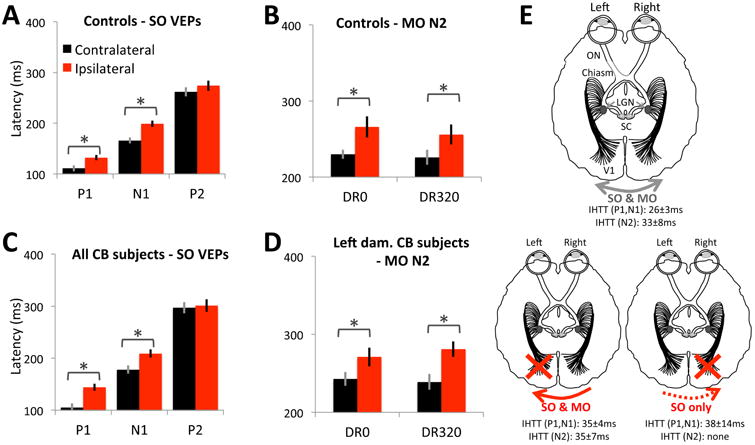
Figure 8.

Latencies of visually-evoked components and inter-hemispheric transfer patterns in controls and CB subjects. A. Mean latencies for SO-P1, N1 and P2 components obtained from brain hemispheres contralateral (black bars) and ipsilateral (red bars) to visual stimuli presented to control subjects. A significant delay is observed between contra- versus ipsilaterally evoked responses for all components except for P2. B. Mean latencies for the MO-N2 component elicited from brain hemispheres contralateral and ipsilateral to visual stimuli (either DR0 – left bars, or DR320 – right bars) presented to control subjects. Note the significant delay for information reaching the ipsilateral brain hemisphere. C. Mean latencies for SO-P1, N1 and P2 components obtained from brain hemispheres contralateral and ipsilateral to visual stimuli presented to CB subjects. Data were averaged across all subjects. D. Mean latencies for the MO-N2 component elicited from brain hemispheres contralateral and ipsilateral to visual stimuli (either DR0 or DR320) presented to CB subjects with left brain hemisphere damage. Right-damaged subjects did not exhibit interhemispheric transfer for motion-evoked responses. Error bars = SEM. * = significant differences (see text for statistics). E. Schematic representation of interhemispheric transfer in visually intact controls (top diagram), as well as CB subjects with either left or right brain hemisphere V damage (bottom two diagrams). Mean ± SEM interhemispheric transfer times (IHTT) are provided for SO and MO-VEPs which exhibited them. LGN: lateral geniculate nucleus, SC: superior colliculus.
