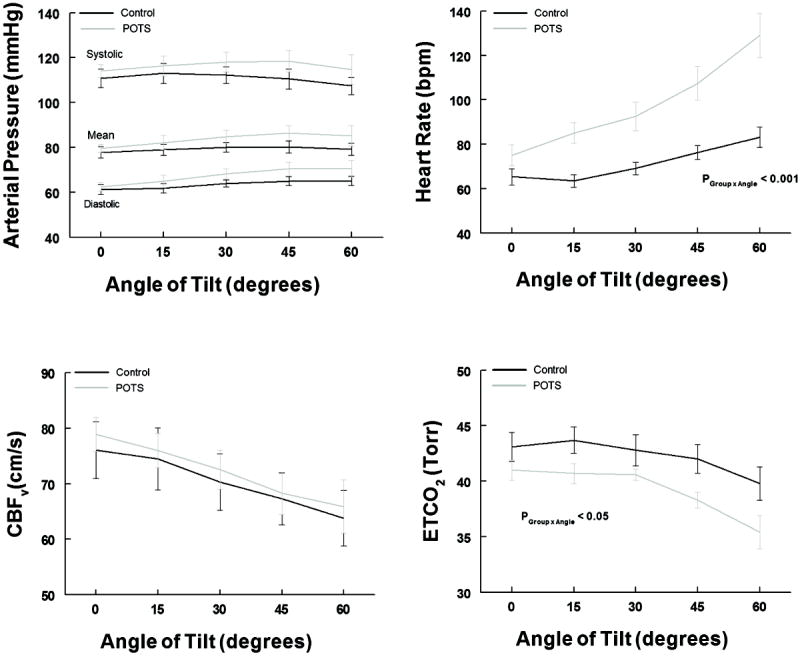
Figure 1.

shows systolic, mean and diastolic arterial pressure in the left upper panel, Cerebral Blood Flow Velocity (CBFv) in the left lower panel, heart rate in beats per minute (bpm) in the right upper panel and End Tidal CO2 (ETCO2) in the right lower panel, all as a function of angle of tilt. Control is shown in black and POTS is in gray. There is no group difference in AP or CBFv. Heart rate is significantly increased in POTS (p<0.001 as shown) and ETCO2 is significantly decreased (p<0.05 as shown).
