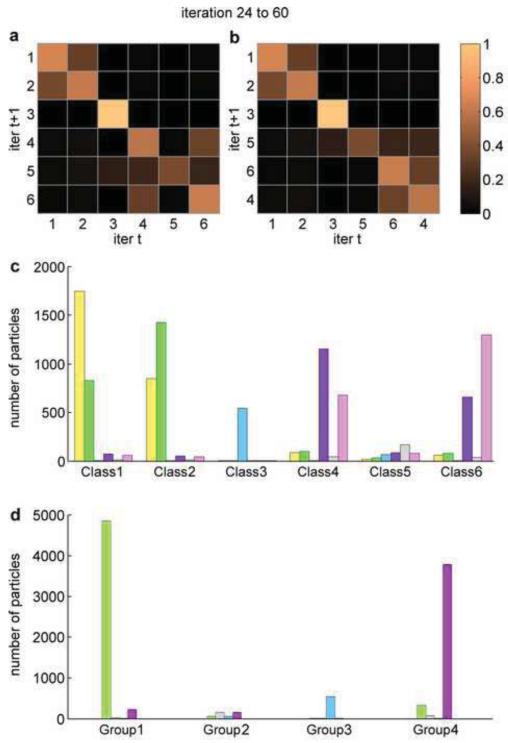
Figure 2.
Transition matrix and bar diagram after the iteration of convergence. (a,b) Transition matrix before (T M24~60, panel (a)) and after (A24~60, panel (b)) agglomerative rearrangement, respectively. The order of classes in panel (b) is represented by [q] in the text. Heatmap color scheme from dark to light corresponds to values 0% to 100% in the transition matrix. There are notable size of commuting jumper particles between Class 1 and Class 2, and between Class 6 and Class 4. (c,d) Bar diagram before (c) and after (d) combining classes into new groups. Class 1 and Class 2 are combined into Group 1. Class 5 is assigned as Group 2. Class 3 is assigned as Group 3. Class 4 and Class 6 are combined into Group 4.

