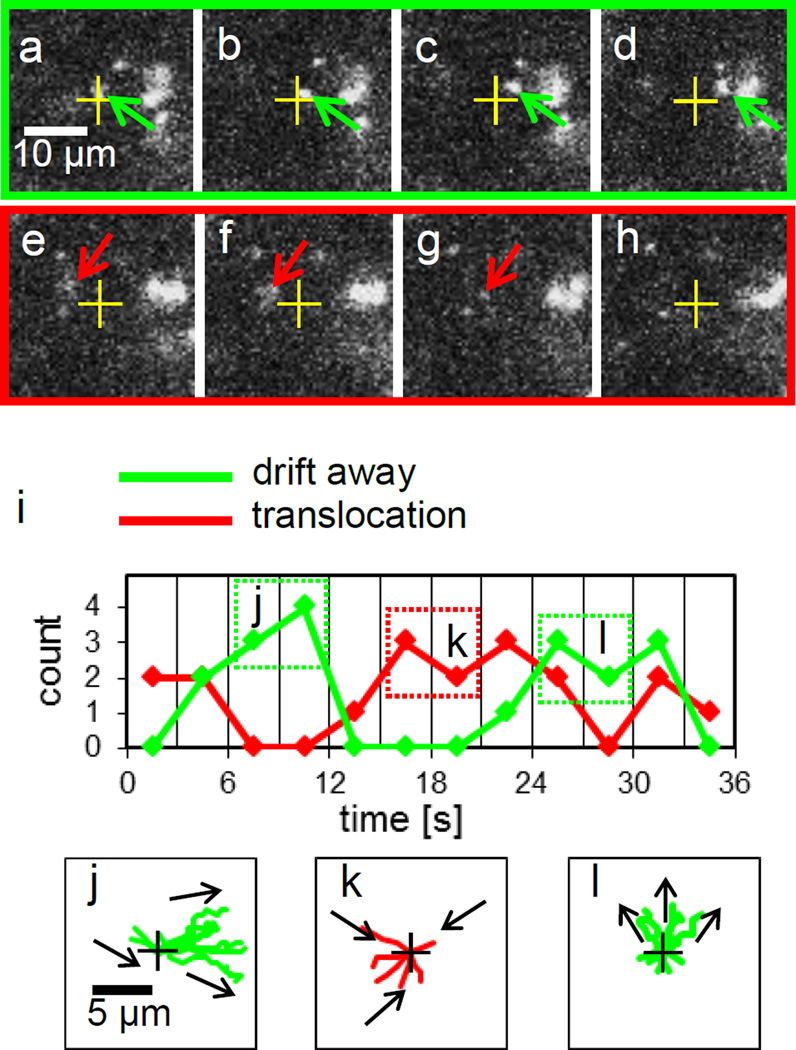
Figure 4.
DNA motions near a nanopore at Vgate = 0.5 V, Vcis = 0 and Vtrans = 0.3 V in 0.01 M KCl. (a) – (h) Images extracted every other frame from a 14 frames per second movie. Time intervals between the sequential images are 0.14 sec. (a) The image near t = 6 sec. One green arrow points a DNA molecule moving away from a nanopore depicted as a cross in the images from (a) to (d). (e) The image near t =15 sec. One red arrow points a DNA molecule moving toward a nanopore in the images from (e) to (g) and then entering the pore before the image (h). (i) Count the number of DNA molecules entering within r < 2.1 µm either translocations (red) or drift away (green) in every 3 seconds. For example, from t = 6 to 12 sec, no DNA molecules enter the nanopore, they all drift away toward right as shown by the 7 DNA trajectories, depicted in the green dotted box j in (i). Instead, all 6 DNA molecules in the red dotted box k on (i), entered the nanopore from t = 15 to 21 sec as their trajectories are plotted in (k). After t = 24, as the green dotted box l depicts, DNA molecules drifting away again. The anisotropic DNA drift motions are shown in their trajectories plotted in (l).

