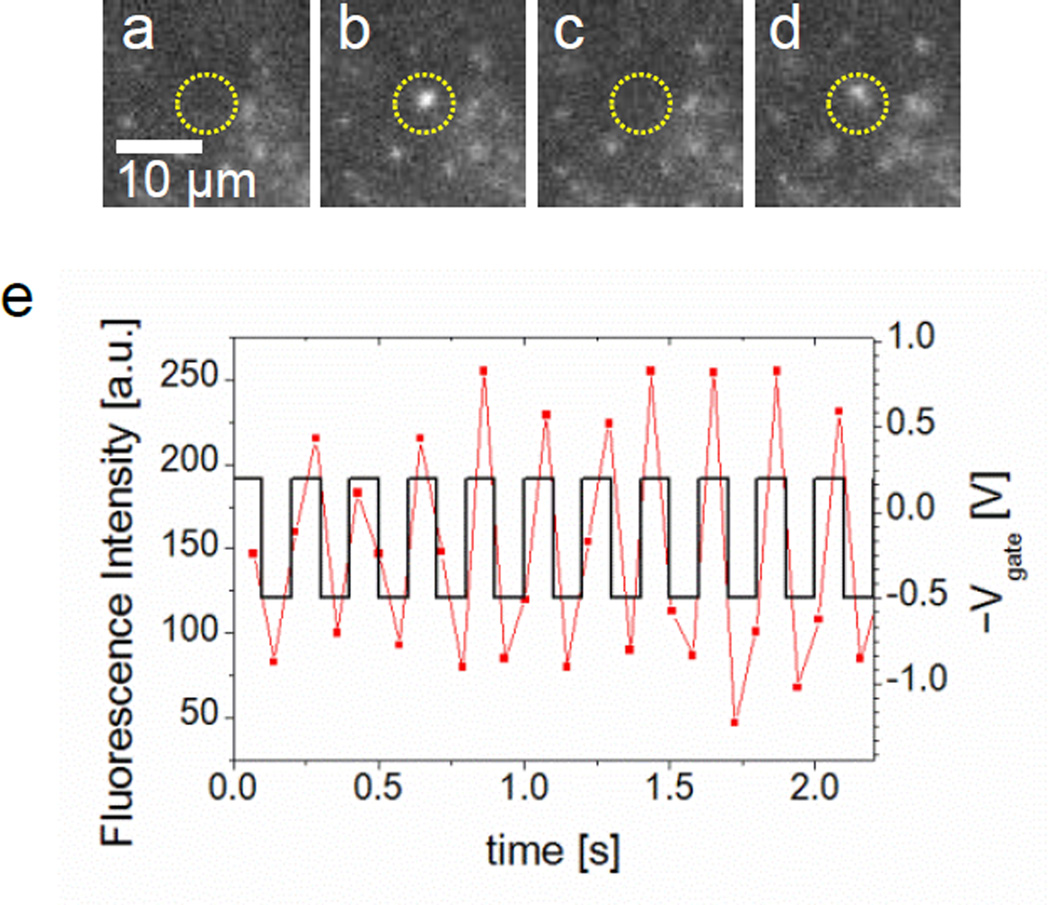
Figure 5.
A single DNA molecule oscillating in a nanopore by applying a 5 Hz square wave with 0.7 Vpp and 0.15 V offset on Vgate relative to Vcis in 0.01 M KCl. (a) – (d) Image frames with a nanopore marked in a yellow circle are selected at t = 0.79, 0.86, 0.93 and 1.08 sec. A DNA molecule blinking at the nanopore is detected as a DNA appears in (b) and (d) while not in (a) and (c). (e) Fluorescence intensity of the DNA with the square wave is plotted in time. Synchronization between them is identified. Blue circled points are the intensity values for the presented images from (a) to (d) above.

