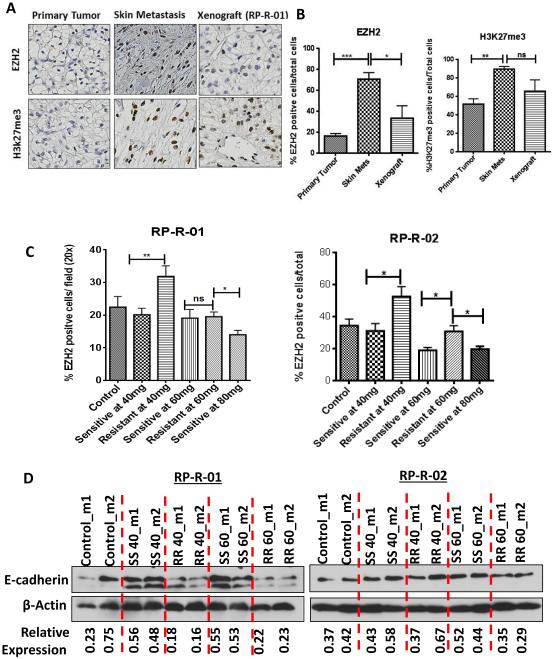
Figure 3. Epigenetic modification associated with resistance to sunitinib resistance and disease progression.
Sections from the original nephrectomy, the skin metastasis developed on sunitinib from the same patient, and the derived xenograft (RP-R-01) sensitive again to sunitinib were stained for EZH2 and H3K27me3. B) Quantitative analyses were performed. IHC quantitative results are based on four randomly selected fields per tissue and are expressed as the mean % positive cells/total cells ± SE. C) As shown in Fig. 1A-B, tissue samples from control, tumors sensitive and resistant to sunitinib at each dose were fixed for 24hr and paraffin embedded. Quantitative analyses were performed. D) Expression levels of E-cadherin were assessed by immunoblotting assay of tumor lysates. Total β-actin was also assessed as loading control and relative expression levels were determined by densitometry. Statistical significance was determined by student’s t-test. *p<0.05, **p<0.01, ***p< 0.001 ns= not significant.

