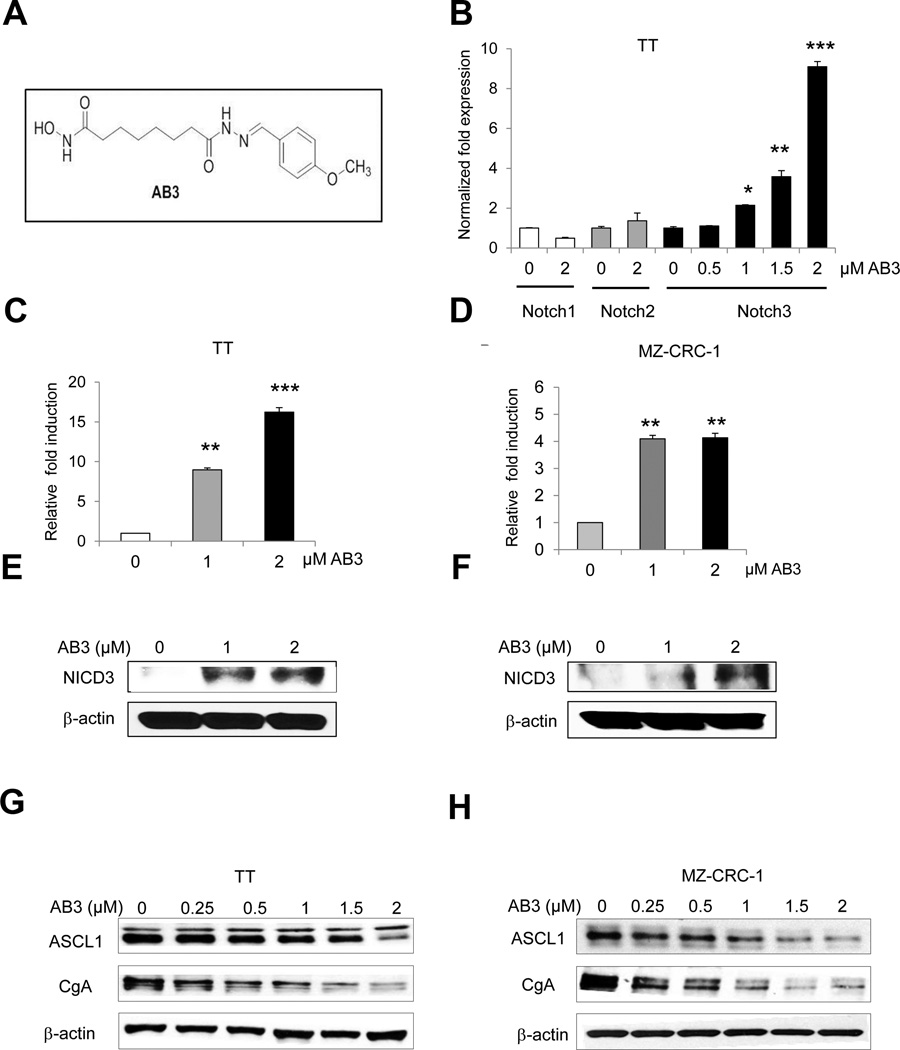
Figure 5. AB3 induces Notch3 signaling in MTC cell lines.
(A) Chemical structure of HDAC inhibitor, AB3. (B) AB3 induced Notch3 in TT cells at the mRNA level in a dose–dependent manner, measured by qRT-PCR. Notch1 and Notch2 isoforms did not respond to AB3 treatment. (C) TT and (D) MZ-CRC-1 cells were transiently transfected with a luciferase construct containing four CBF1-binding sites (4 × CBF1- Luc) and treated with various concentrations of AB3 up to 48 hours. NICD3 function was assessed by the degree of NICD3–CBF1 binding measured by luciferase reporter assay. Luciferase values were normalized to β-galactosidase activity and are expressed as fold increase relative to cells not treated with AB3. All values are presented as a mean ±SD (n=3). Western blot analysis of Notch3 intracellular domain (NICD3) in TT (E) and MZ-CRC-1 cells (F) treated with different concentrations of AB3 or vehicle control. Equal loading was confirmed with β–actin. 48 hours of AB3 treatment resulted in dose-dependent reduction in NE markers expression ASCL1 and CgA in TT (G) and MZ-CRC-1 (H) cell lines. *, P<0.05,**, P<0.01,***, P<0.001.

