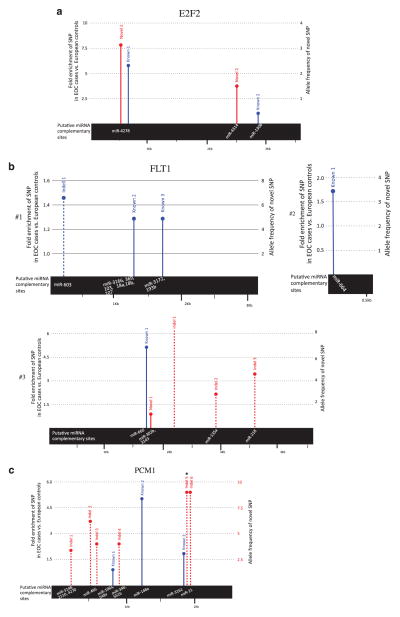
Figure 2.
The SNPs and indels identified in our EOC cases. All novel SNPs and indels identified in EOC cases and only those known variants that were found to be enriched in EOC cases compared with reference European population controls from the 1000 Genomes Project were mapped to their relative positions in the 3′UTR of (a) E2F2, (b) FLT1 (three separate 3′UTR transcripts) and (c) PCM1 genes, respectively. The solid line represents a SNP, dashed line represents an indel, red indicates novel SNP/indel, blue is known SNP/indel and the height of the bar represents the fold enrichment of known SNPs/indels in our EOC cases vs reference European population controls from the 1000 Genomes Project or the allele frequency of novel SNPs in cases. The bar with a circular end represents SNPs within high confidence miRNA complementary sites, which are shown in the black bar. The asterix indicates the novel variant in the PCM1 3′UTR found to be significantly enriched in EOC cases.

