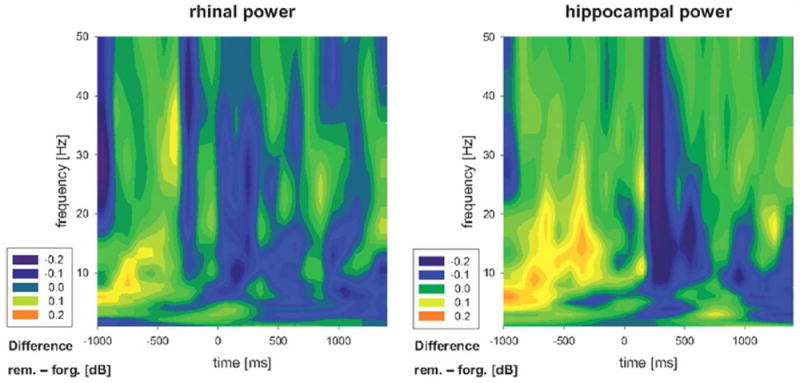
Figure 1.

Normalized power difference plots for the contrast of subsequently remembered > forgotten words in the rhinal cortex (left) and hippocampus (right) reported in [28]. Power increases are shown primarily in the theta and alpha bands prior to stimulus presentation at encoding. Adapted from [28].
