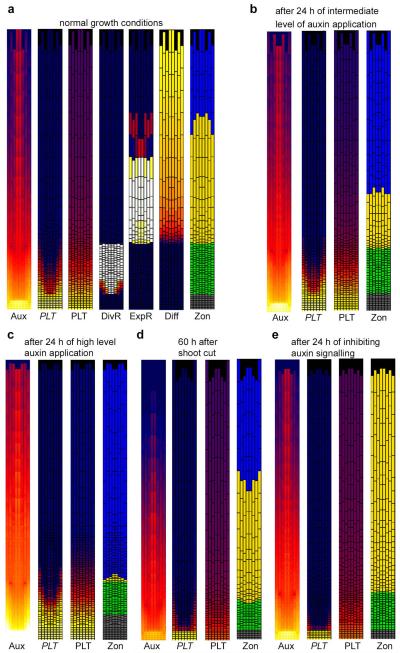
Extended Data Figure 8. Simulation of zonation dynamics in the auxin model under normal conditions and conditions of perturbed auxin (signalling).
a, Zonation dynamics under normal growth conditions. b, Zonation dynamics after 24 h of intermediate level auxin application. c, Zonation dynamics after 24 h of high level auxin application. d, Zonation dynamics 60 h after shoot cut. e, Zonation dynamics after 24 h of inhibited auxin signalling. Shown are snapshots of auxin (Aux), PLT transcription (PLT), PLT protein (PLT) and zonation (Zon) profiles. In addition, for the normal growth conditions, snapshots of division rates (DivR), expansion rates (ExpR) and differentiation levels (Diff) are shown.

