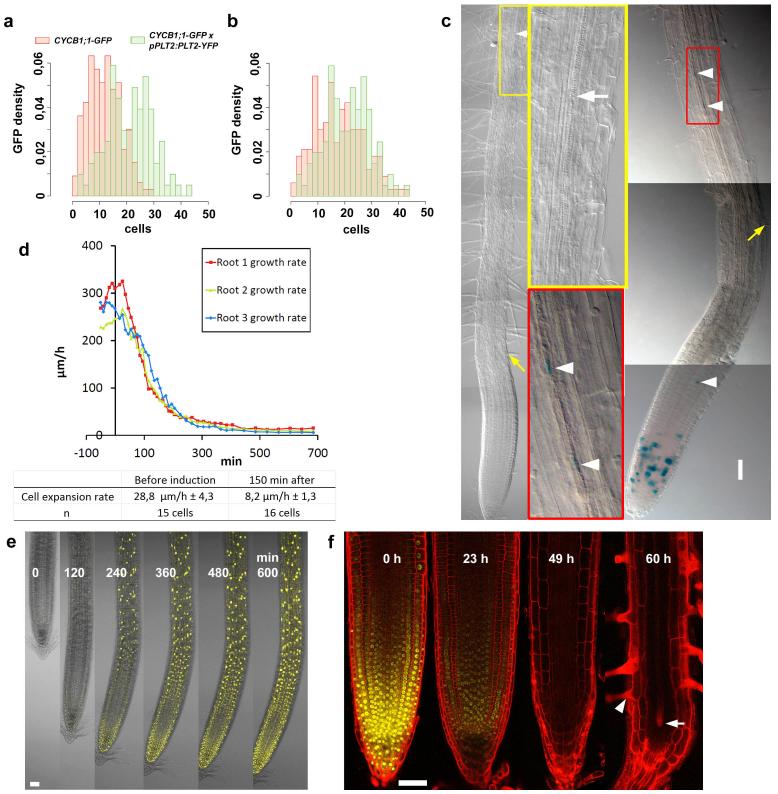
Extended Data Figure 1. PLTs are dose-dependent drivers of zonation.
a, b, The domain of frequent cell division, monitored by cell cycle marker CYCB1;1–GFP in Fig. 1b, c, shifts shootward with increased PLT2 dosage (that is, homozygote pPLT2:PLT2-YFP in Col background). Histogram in a shows the distribution of the CYCB1;1–GFP-positive cells along the meristem at a given distance from the quiescent centre. x-Axis indicates the distance from the quiescent centre as number of cortical cells, and y-axis label ‘GFP density’ refers to the proportion of CYCB1;1–GFP-containing cells at the given distance from the quiescent centre. Shootward shift of the distance of the cell division events in the presence of increased PLT2 (green histogram) dosage compared to wild-type (red histogram) is significant (t-test for mean P << 0.001, Wilcoxon test for median P << 0.001, Kolmogorov–Smirnov for difference of distributions P << 0.001). b, Histogram presenting rescaled data to show that the distribution of the high cell division domain shifted shootward when PLT2 dosage was increased. A null hypothesis was that shootward shift is due to higher dispersion of the distribution observed under increased PLT2 dosage. To test this hypothesis, the control CYCB1;1–GFP data were rescaled to match the maximum values of PLT2 data. The null hypothesis was rejected (t-test P = 0.001, Wilcoxon test P = 0.0012, Kolmogorov–Smirnov P = 0.0026), indicating that the shootward shift of the high division domain in the presence of increased PLT2 dosage is significant, and not due to dispersion. The bin width in histograms is two cells (that is, 1st bar, 1 and 2 cells; 2nd, 3 and 4, and so on). c, Induction of pAHP6:XVE>>PLT2-YFP inhibits xylem differentiation (left) (white arrow indicates the first protoxylem element) and triggers ectopic cell divisions illustrated by CYCB1;1–GUS activity (right) (arrowheads), whereas root hairs develop normally (yellow arrows). Insets show magnifications from the designated areas. d, PLT2–YFP induction (t = 0) rapidly inhibits root growth (top) and cell expansion (bottom) in three roots. Expansion rates as shown as averages ± s.d. e, Inhibition of growth coincides with appearance of PLT2–YFP signal after induction. f, Induction of PLT2 RNAi (in plt1,3,4; pPLT2:PLT2-YFP) abolishes the PLT2–YFP signal by 49 h and consequently promotes expansion and differentiation of the meristem cells, as indicated by the appearance of expanded cells as well as protoxylem (arrow) and root hairs (arrowhead) in the meristem. Images from the same root using identical confocal microscopy settings for the yellow channel. Scale bars, 50 μm.

