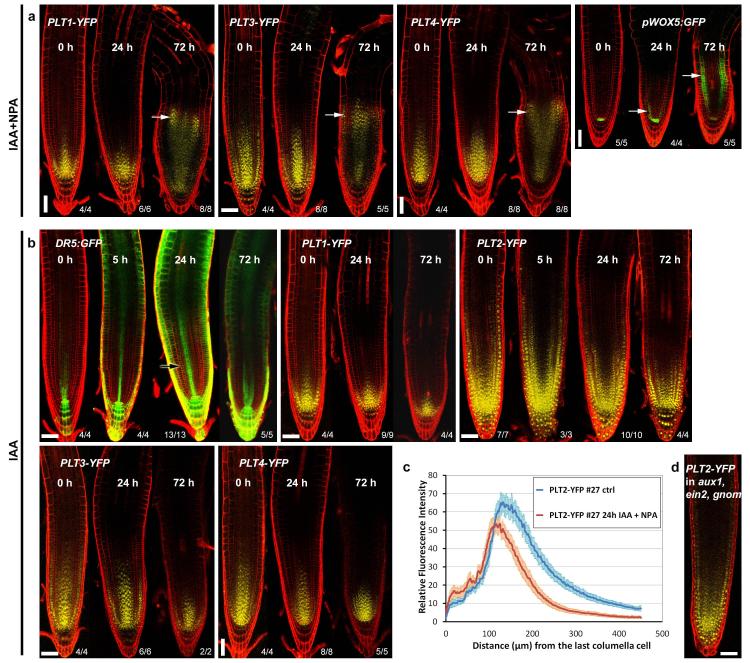
Extended Data Figure 2. PLT expression patterns respond only to long-term auxin accumulation in the meristem.
a, PLT expression shifts shootward only when prolonged auxin application is accompanied with polar auxin transport inhibitor (NPA) treatment. Four-day-old seedlings were transferred to an agar plate containing 20 μM NPA plus 5 μM IAA for the time periods indicated in the images. The expression of pPLT1:PLT1-YFP, pPLT3:PLT3-YFP and pPLT4:PLT4-YFP spreads shootward (white arrows) by 72 h of NPA plus IAA treatment. b, PLT expression patterns are insensitive for auxin-only treatments. Four-day-old seedlings were transferred to an agar plate containing 5 μM IAA for the time periods indicated in the images. The auxin response reporter DR5:erGFP rapidly responded to the treatment whereas the expression domains of pPLT1:PLT1-YFP, pPLT2:PLT2-YFP, pPLT3:PLT3-YFP and pPLT4:PLT4-YFP failed to expand. Black arrow indicates the region in meristem that is absent of DR5:erGFP fluorescence after IAA treatment but is filled with fluorescence after NPA plus IAA treatment (Fig. 2a). Observed phenotypes/number of roots analysed are indicated in the right bottom corners. c, Twenty-four hours of NPA plus IAA treatment fails to expand the PLT2–YFP gradient shootward. In fact, the treatment leads to transient shortening of the PLT2–YFP gradient, probably due to inhibition of growth dilution of PLT2–YFP in the meristematic cells (see Fig. 3g, h). P << 0.001, Kolmogorov–Smirnov test; error bars indicate 95% confidence intervals. n = 20 (dimethylsulphoxide (DMSO)) and 23 (NPA plus IAA). d, Graded pPLT2:PLT2-YFP expression despite shallow auxin gradient in aux1,ein2,gnom; representative image from three independent lines. Scale bars, 50 μm.

