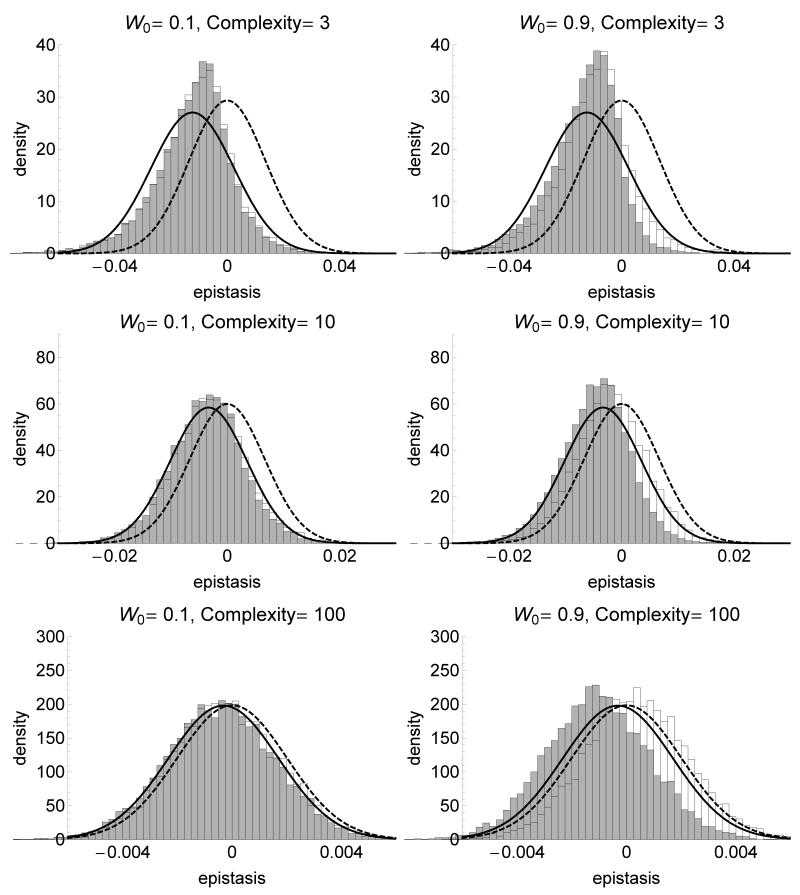
Figure 3.
Distribution of the epistasis coefficient e between two independently selected mutations (grey) and for co-selected mutations (white) for various fitnesses of the ancestral strain W0 (left: far from the optimum, right: near the optimum) and complexities of the phenotypic space (from bottom to top). The plain line is the analytical approximation for independently selected mutations based on a normal distribution with mean and variance given by equation (4), and the dashed line is the normal approximation for random (newly arising) mutations (Martin et al. 2007). For independently selected mutations, the first mutations sweeping through the population in each of 20000 independent replicates were selected, and epistasis coefficient is calculated for 10000 independent pairs of selected mutations. For co-selected mutations, the first two mutations sweeping through the population in each of 10000 independent replicates were selected, resulting in 10000 independent epistasis coefficients. σmut is scaled such that the average norm of the mutational effect on phenotype is constant equal to 0.1 across complexities. The population size is N = 107 and the mutation rate μ = 10−9.

