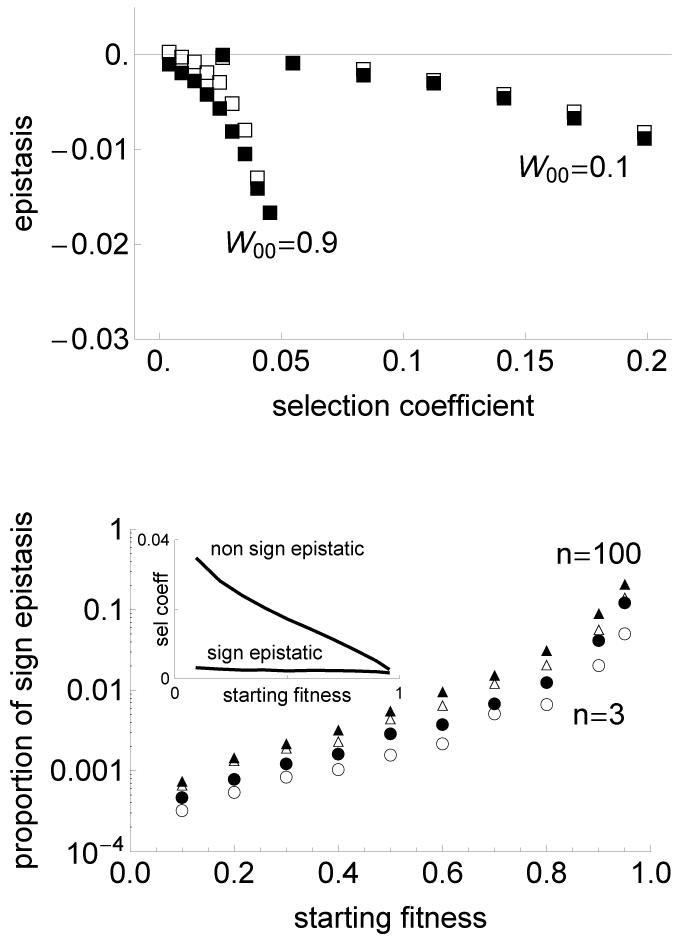
Figure 4.
Relationship between epistasis and the selection coefficient. Top panel: average epistasis coefficient between pairs of mutations as a function of the average selection coefficient of the two mutations, when W00 = 0.1 and W00 = 0.9, between independently selected mutations (filled squares) and co-selected mutations (open squares). For each parameter set, the selection coefficients were binned in 10 intervals of size (smax − smin)/10 and the average epistasis was computed for each of these bins when at least 10 pairs of mutations were present. For all curves complexity n = 10 (relationships are similar for other values of n). Bottom panel: Fraction of sign epistasis between two independently selected mutations (filled symbols) and between two co-selected mutations (open symbols). This is shown for complexities of the phenotypic space n = 3 (circles) and 100 (triangles). Inset shows the average coefficient of selection among non sign epistatic mutations (top curve) and sign epistatic mutations (bottom curve), as a function of the starting fitness, for complexity n = 3 and independently selected mutations (curves are similar for other parameters and selection procedure). The fraction of sign epistasis is calculated among at least 2000 independent pairs of mutations. Other parameters as in fig. 3.

