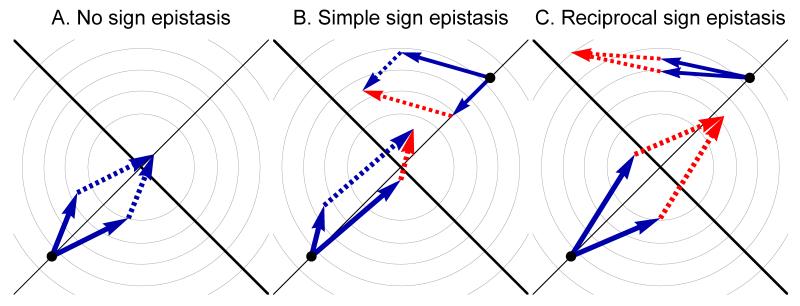
Figure 5.
The geometry of sign epistasis among two mutations in a two-dimensional Fisher’s fitness landscape model. The light gray lines are the fitness isoclines and the black lines are the phenotypic axes. Beneficial and deleterious mutations are shown respectively as blue and red arrows in the phenotypic space. In panel A, the two mutations are beneficial in the ancestral background and in the background with the other mutation (no sign epistasis). In panels B and C, two examples of pairs of sign epistatic mutations are shown. In B, one of the mutations is deleterious in the background with the other mutation (simple sign epistasis). In C, both mutations are deleterious in the background with the other mutation (reciprocal sign epistasis). In B and C, sign epistasis may occur by antagonistic pleiotropy (up, right) or optimum overshooting (bottom, left).

