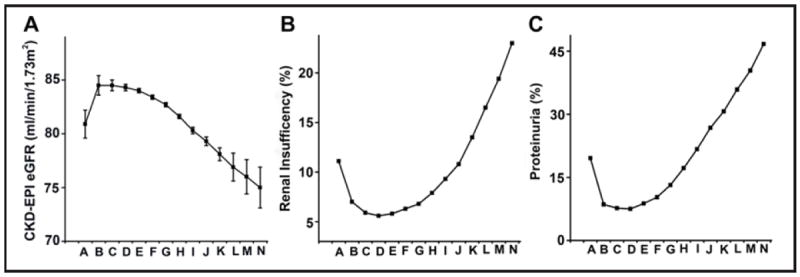
Fig. 2.

Effects of different SBP strata on GFR, renal insufficiency prevalence and proteinuria prevalence. GFR was expressed in mean±SE. A, B, C, D, E, F, G, H, I, J, K, L, M and N represents 80-89mmHg, 90-99mmHg, 100-109mmHg, 110-119mmHg, 120-129mmHg, 130-139mmHg, 140-149mmHg, 150-159mmHg, 160-169mmHg, 170-179mmHg, 180-189mmHg, 190-199mmHg, 200-209mmHg and 210-220mmHg stratum, respectively.
