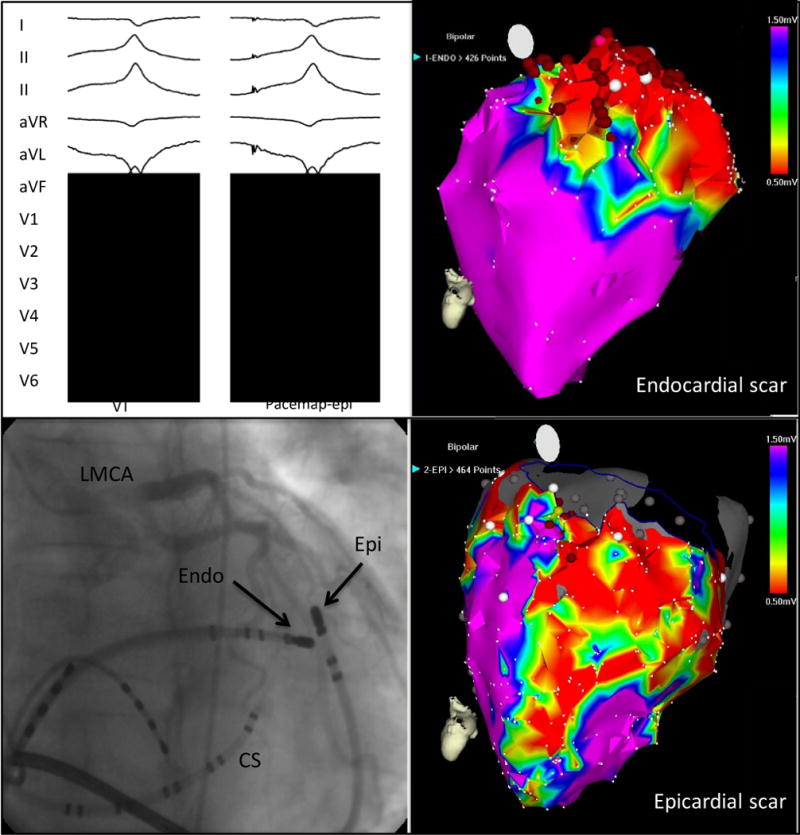
Figure 6.

Epicardial Mapping and Ablation of VT. A 12-lead ECG of clinical ventricular tachycardia with a perfect pace map of the ventricular tachycardia from the epicardium. Top left, combined epicardial (Epi) and endocardial (Endo) mapping in the left anterior oblique projection (bottom left). A coronary sinus (CS) catheter is shown. Electroanatomic mapping demonstrates a greater extent of epicardial (bottom right) scar compared with endocardial scar (top right). Red circles represent areas of radiofrequency application. LMCA indicates left main coronary artery. (modified from Tung et al120, used with permission)
